
- Home >
- Stock Photos >
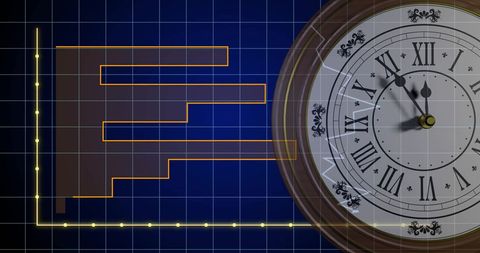
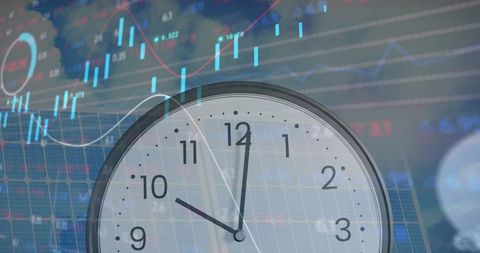
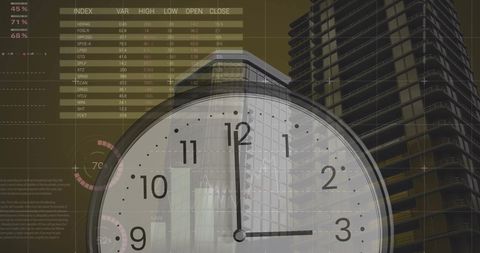
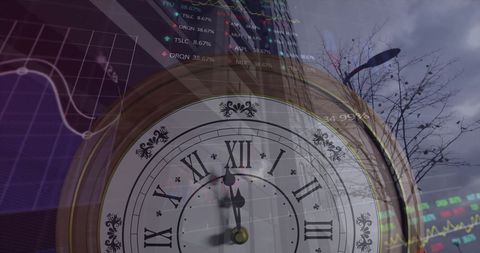
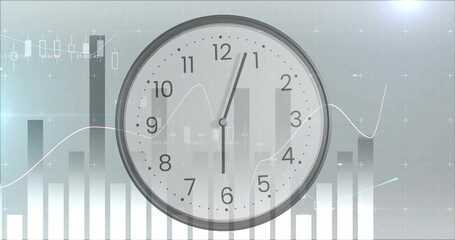
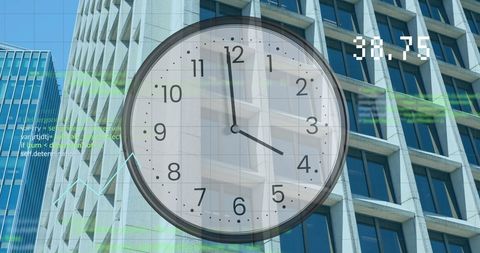
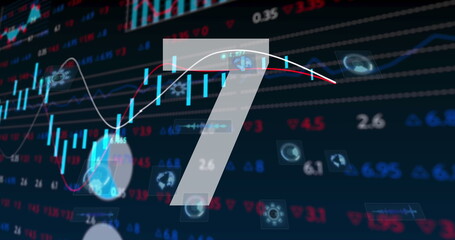
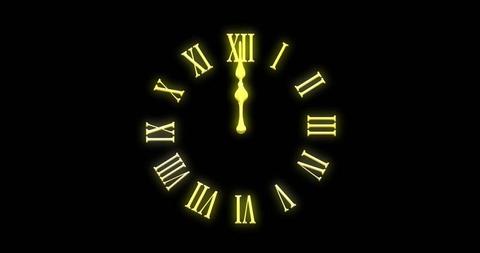
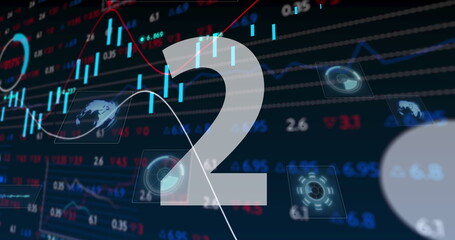
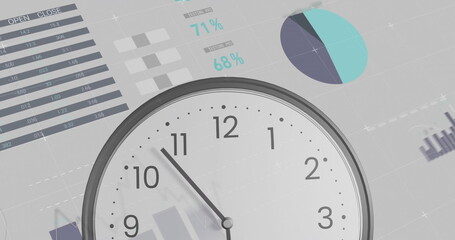
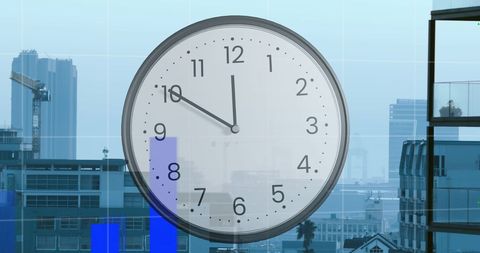
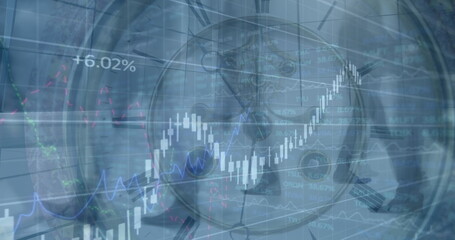
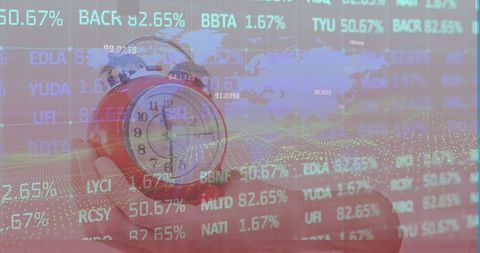
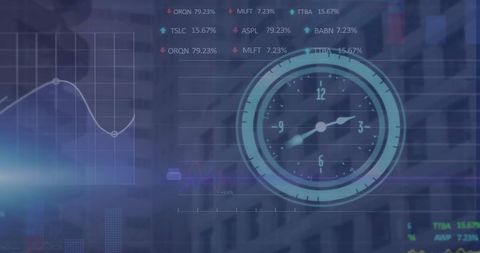
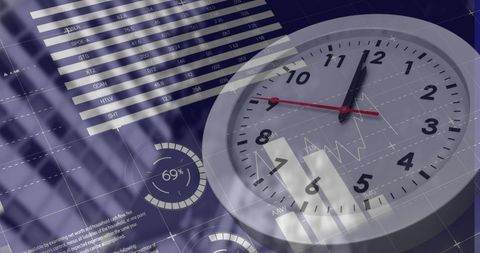
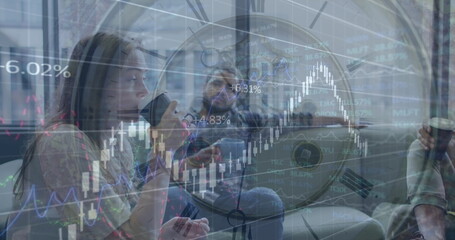
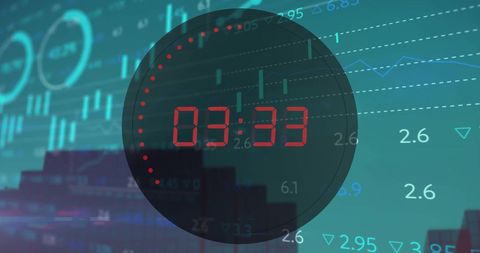
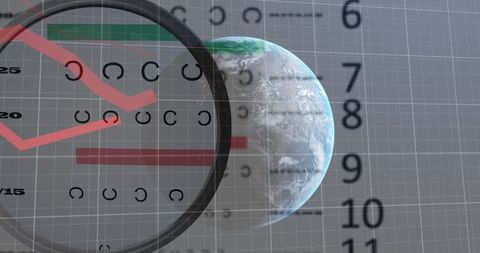
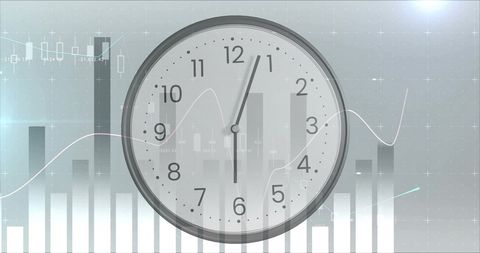
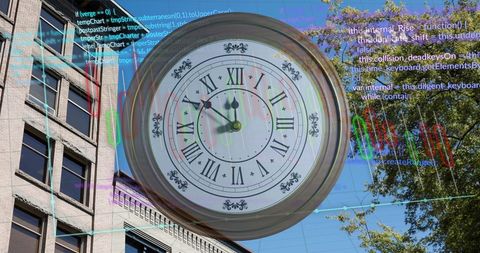
- Time and Data Visualizing Stock Market Trends
Time and Data Visualizing Stock Market Trends Image
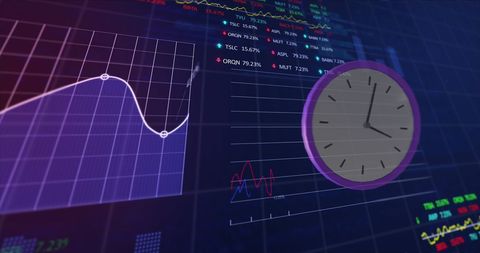
Digital-rendered graphic showing an analog clock, colorful stock market graphs, and data processing on a blue background. Visual intertwined theme suggests relationship between time and financial analysis. Perfect for illustrating concepts in finance, trading trends, data analytics education, and technology in classroom or digital learning environments.
Powered by 


downloads
Tags:
More
Credit Photo
If you would like to credit the Photo, here are some ways you can do so
Text Link
photo Link
<span class="text-link">
<span>
<a target="_blank" href=https://pikwizard.com/photo/time-and-data-visualizing-stock-market-trends/e2f17e4fa46a8f2b84530238f62cd2e3/>PikWizard</a>
</span>
</span>
<span class="image-link">
<span
style="margin: 0 0 20px 0; display: inline-block; vertical-align: middle; width: 100%;"
>
<a
target="_blank"
href="https://pikwizard.com/photo/time-and-data-visualizing-stock-market-trends/e2f17e4fa46a8f2b84530238f62cd2e3/"
style="text-decoration: none; font-size: 10px; margin: 0;"
>
<img src="https://pikwizard.com/pw/medium/e2f17e4fa46a8f2b84530238f62cd2e3.jpg" style="margin: 0; width: 100%;" alt="" />
<p style="font-size: 12px; margin: 0;">PikWizard</p>
</a>
</span>
</span>
Free (free of charge)
Free for personal and commercial use.
Author: Creative Art
Similar Free Stock Images
Premium


Premium


Premium


Premium


Premium

Premium


Premium

Premium

Premium
Premium


Premium


Premium


Premium


Premium


Premium

Premium


Premium


Premium


Premium


Premium


Premium


Premium


Premium


Premium


Premium


Explore More Free Stock Images