
- Home >
- Stock Photos >
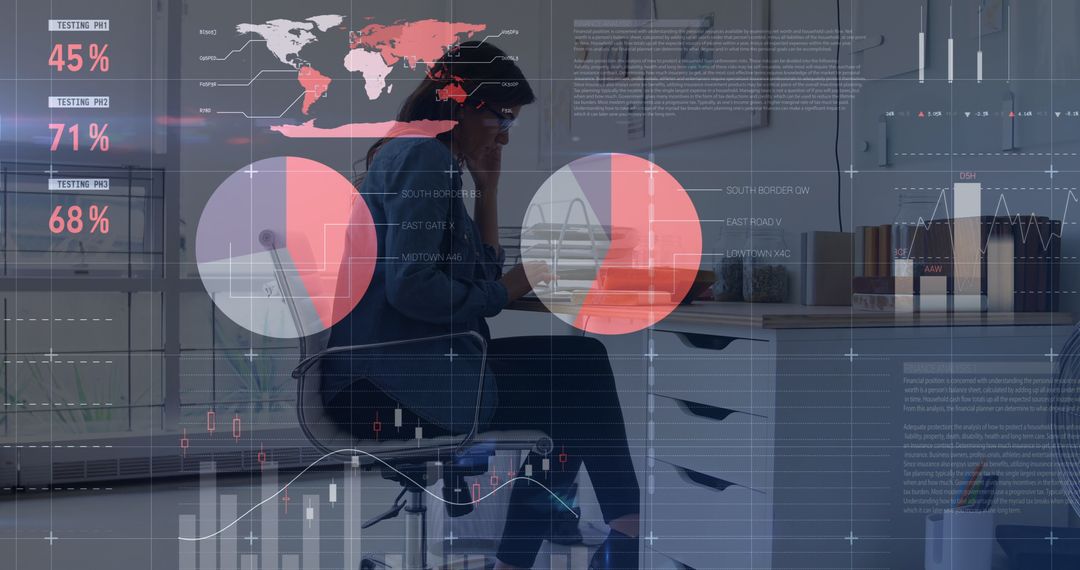
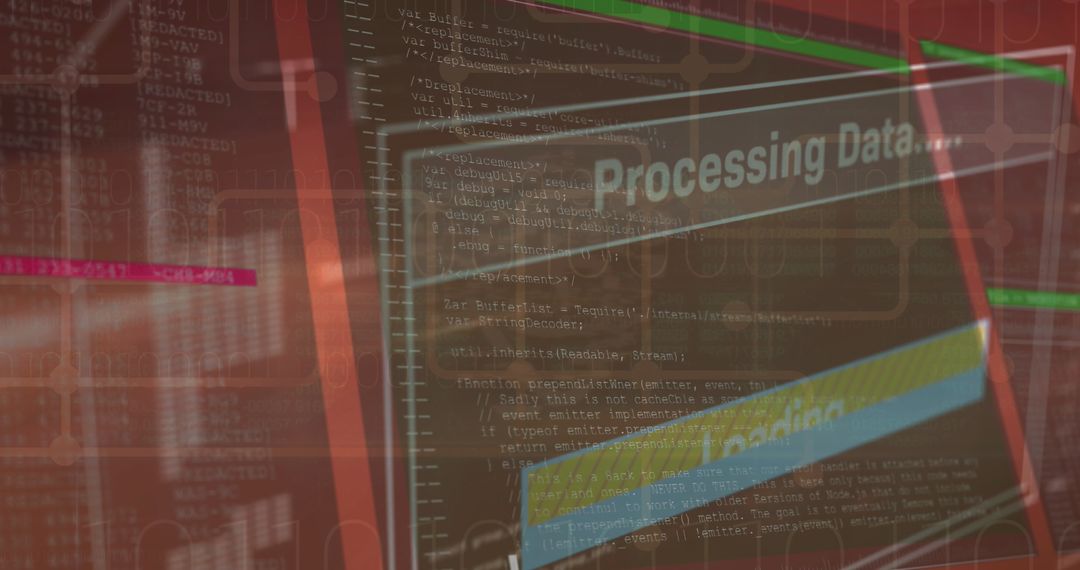
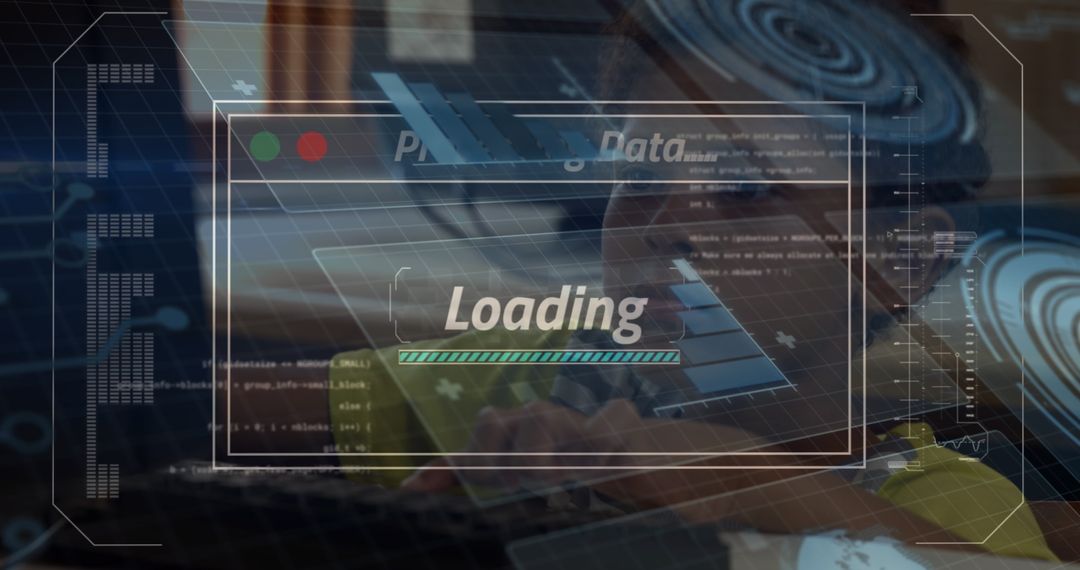
- Time Management and Data Processing in Digital Business Concept
Time Management and Data Processing in Digital Business Concept Image

Image illustrates the integration of time management and data processing in modern business. Overlaid graphics display financial charts and a clock, symbolizing the importance of timely data analysis and decision-making in a digital business environment. Suitable for use in presentations or articles about efficiency, business technology advancements, and data-driven strategies.
Powered by  - Get 15% off with code: PIKWIZARD15


2
downloads
downloads
Tags:
More
Credit Photo
If you would like to credit the Photo, here are some ways you can do so
Text Link
photo Link
<span class="text-link">
<span>
<a target="_blank" href=https://pikwizard.com/photo/time-management-and-data-processing-in-digital-business-concept/c115b0f82f95ff9c749051d13d9625d9/>PikWizard</a>
</span>
</span>
<span class="image-link">
<span
style="margin: 0 0 20px 0; display: inline-block; vertical-align: middle; width: 100%;"
>
<a
target="_blank"
href="https://pikwizard.com/photo/time-management-and-data-processing-in-digital-business-concept/c115b0f82f95ff9c749051d13d9625d9/"
style="text-decoration: none; font-size: 10px; margin: 0;"
>
<img src="https://pikwizard.com/pw/medium/c115b0f82f95ff9c749051d13d9625d9.jpg" style="margin: 0; width: 100%;" alt="" />
<p style="font-size: 12px; margin: 0;">PikWizard</p>
</a>
</span>
</span>
Free (free of charge)
Free for personal and commercial use.
Author: Authentic Images
Similar Free Stock Images

Premium


Premium


Premium


Premium


Premium


Premium


Premium


Premium


Premium


Premium


Premium


Premium


Premium


Premium


Premium


Premium


Premium


Premium


Premium


Premium


Premium


Premium


Premium


Premium

