
- Home >
- Stock Photos >
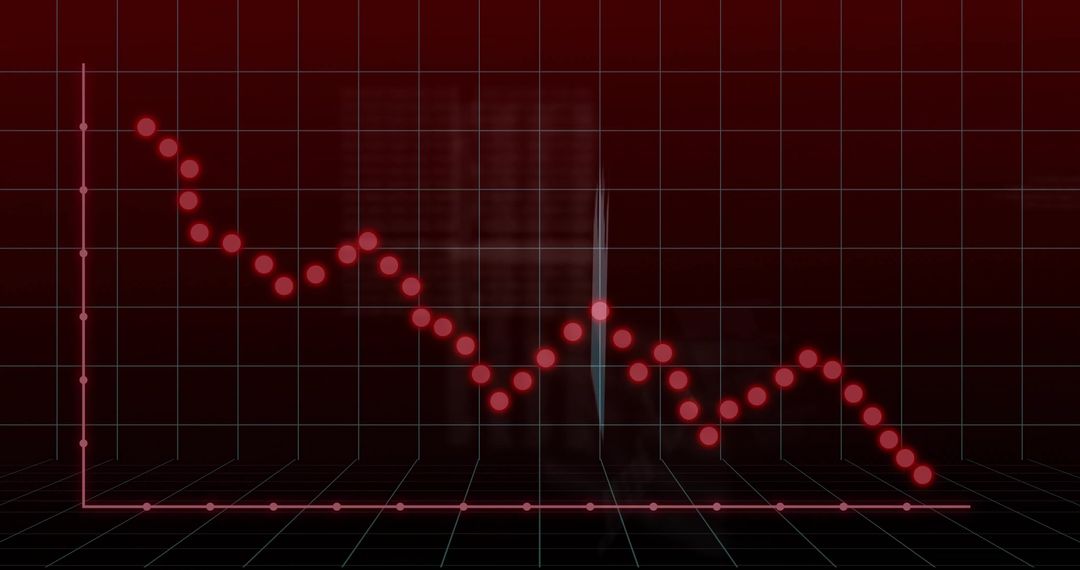
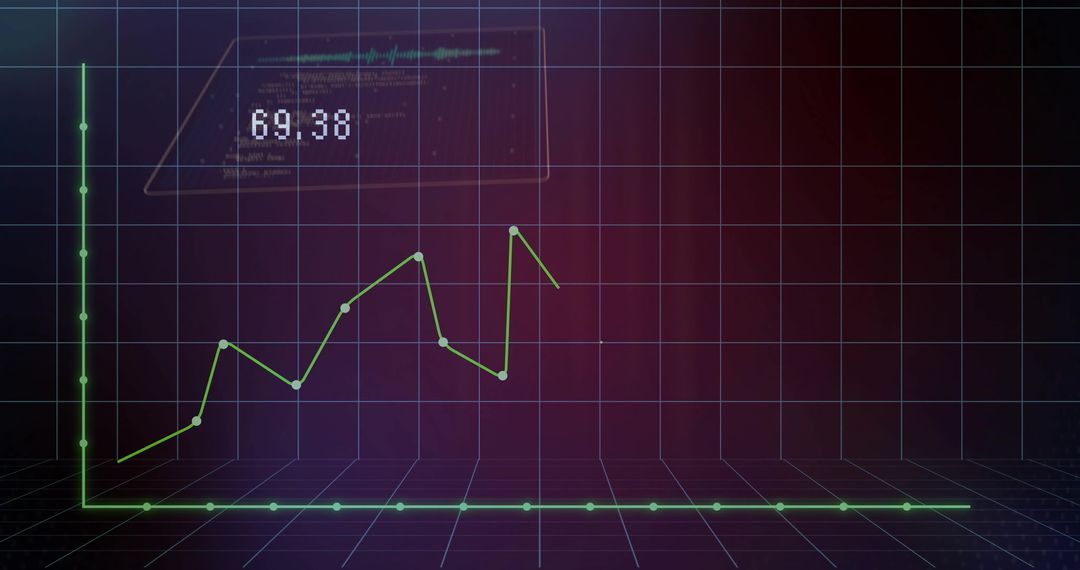
- Tracing Declining Housing Market Trend on Neon 3D Grid with Wireframe House
Tracing Declining Housing Market Trend on Neon 3D Grid with Wireframe House Image

Depicting neon red dotted line tracing downward trend across dark 3D grid with translucent wireframe house silhouette and subtle circuitry texture. Deep crimson palette and retro-futuristic neon highlights creating urgent, high-tech mood. Composition conveying housing market slump, property value decline, financial loss, or data-driven economic analysis. Ideal for use in real estate market reports, financial news graphics, investment presentations, fintech dashboards, blog posts about economic trends, social media campaigns on property values, corporate earnings briefings, or infographic backgrounds. Editable colors and grid elements enabling integration into branded layouts and slide decks.
Powered by  - Get 15% off with code: PIKWIZARD15


0
downloads
downloads
Tags:
More
Credit Photo
If you would like to credit the Photo, here are some ways you can do so
Text Link
photo Link
<span class="text-link">
<span>
<a target="_blank" href=https://pikwizard.com/photo/tracing-declining-housing-market-trend-on-neon-3d-grid-with-wireframe-house/f79c5410e696adad76b227b1da9a1c59/>PikWizard</a>
</span>
</span>
<span class="image-link">
<span
style="margin: 0 0 20px 0; display: inline-block; vertical-align: middle; width: 100%;"
>
<a
target="_blank"
href="https://pikwizard.com/photo/tracing-declining-housing-market-trend-on-neon-3d-grid-with-wireframe-house/f79c5410e696adad76b227b1da9a1c59/"
style="text-decoration: none; font-size: 10px; margin: 0;"
>
<img src="https://pikwizard.com/pw/medium/f79c5410e696adad76b227b1da9a1c59.jpg" style="margin: 0; width: 100%;" alt="" />
<p style="font-size: 12px; margin: 0;">PikWizard</p>
</a>
</span>
</span>
Free (free of charge)
Free for personal and commercial use.
Author: People Creations
Similar Free Stock Images

Premium


Premium


Premium


Premium


Premium


Premium


Premium


Premium


Premium


Premium


Premium


Premium


Premium


Premium


Premium


Premium


Premium


Premium


Premium


Premium


Premium


Premium


Premium


Premium

