- Home >
- Stock Photos >
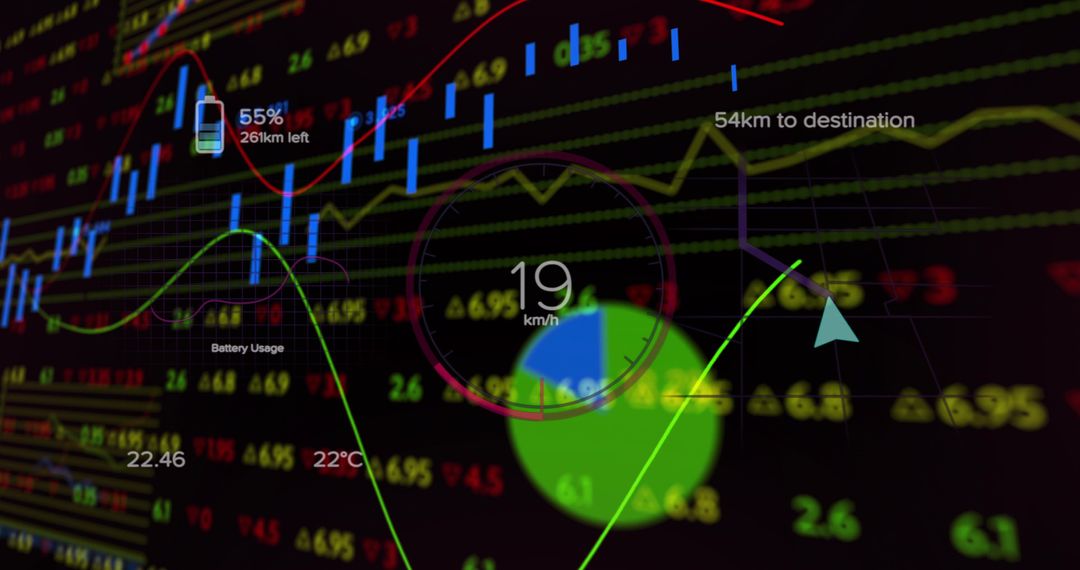
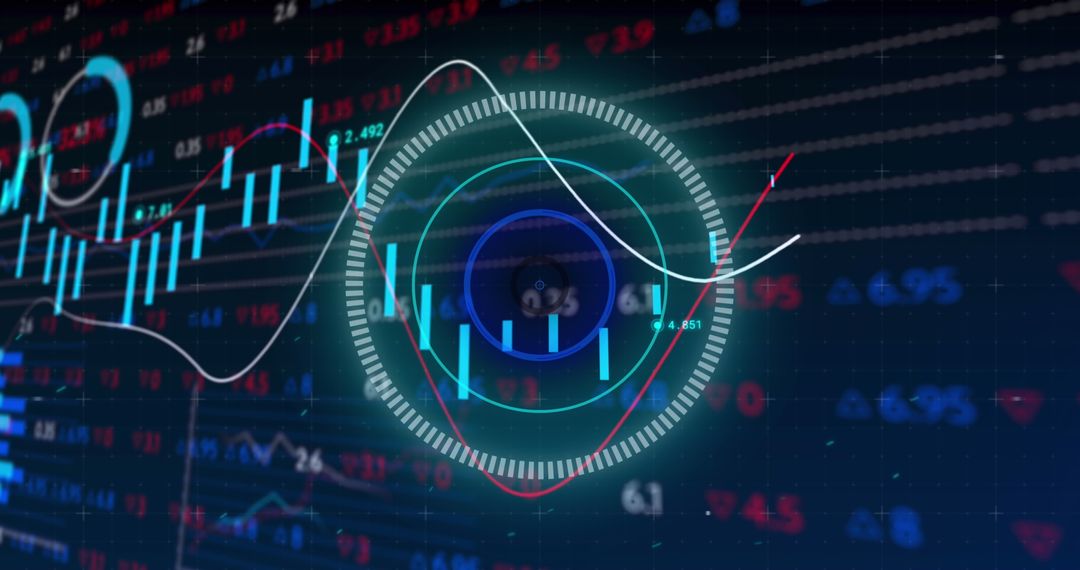
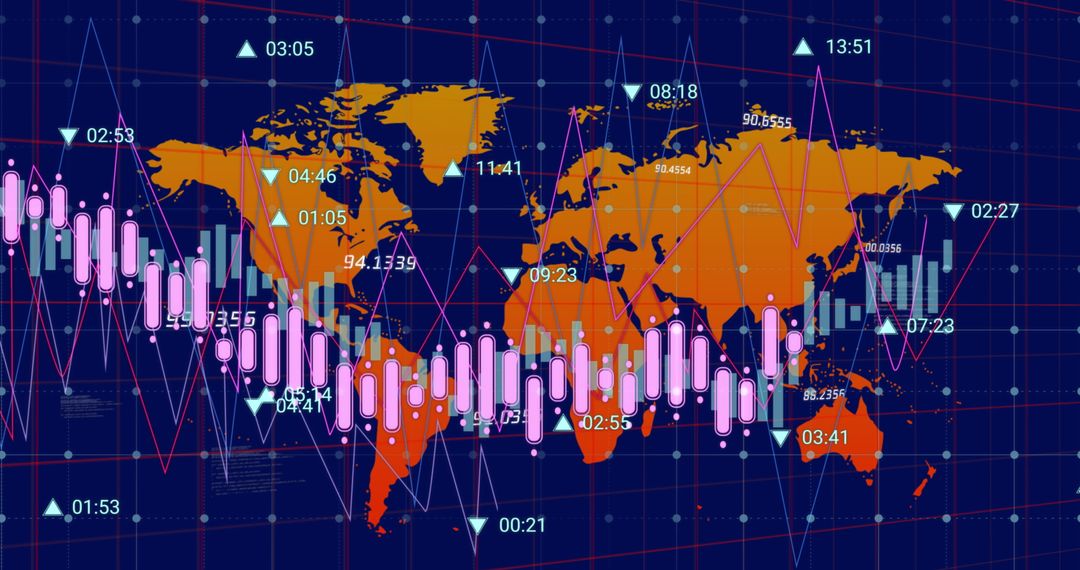
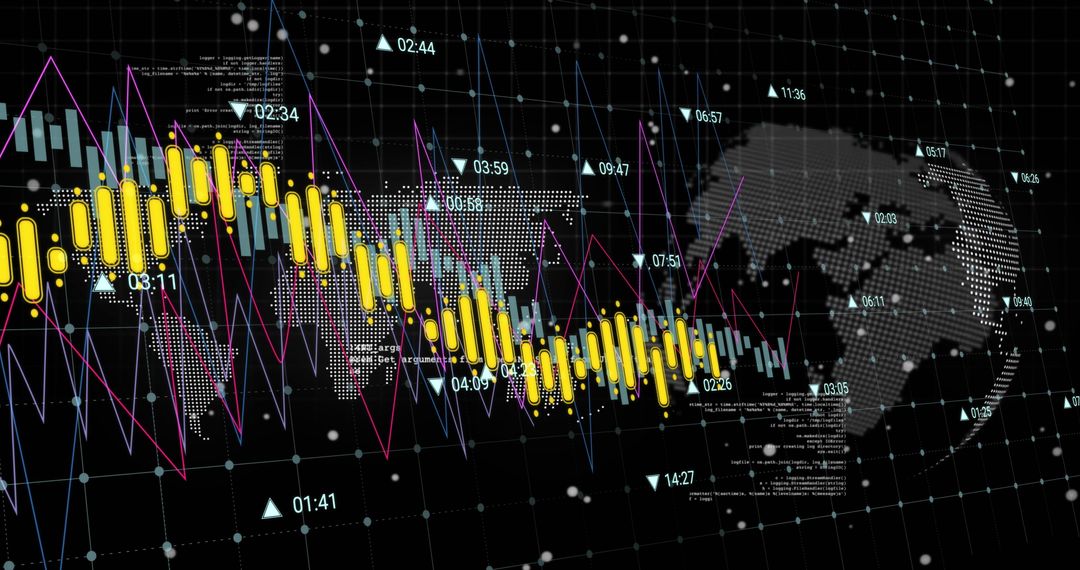
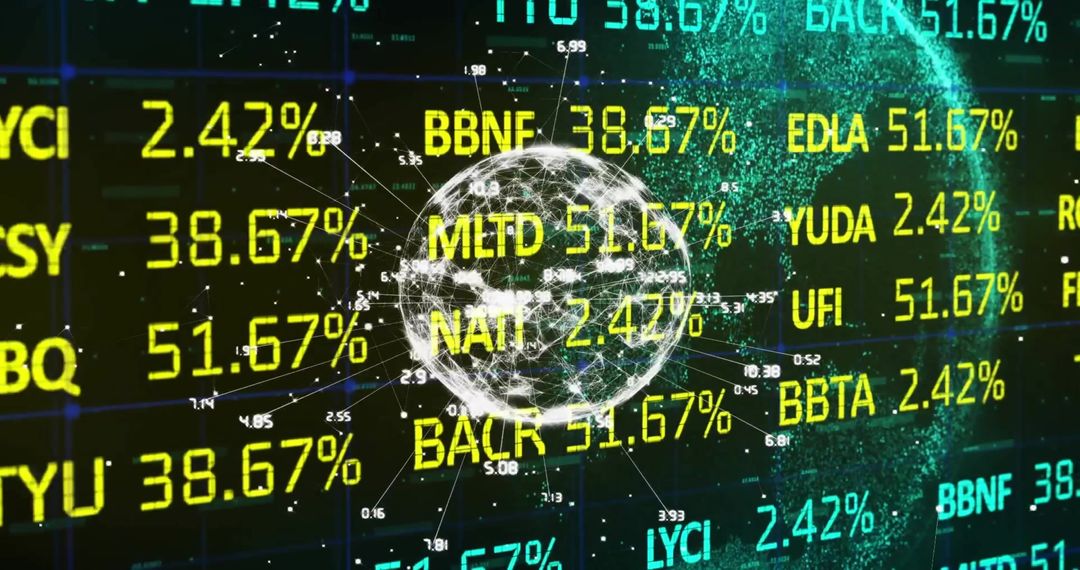
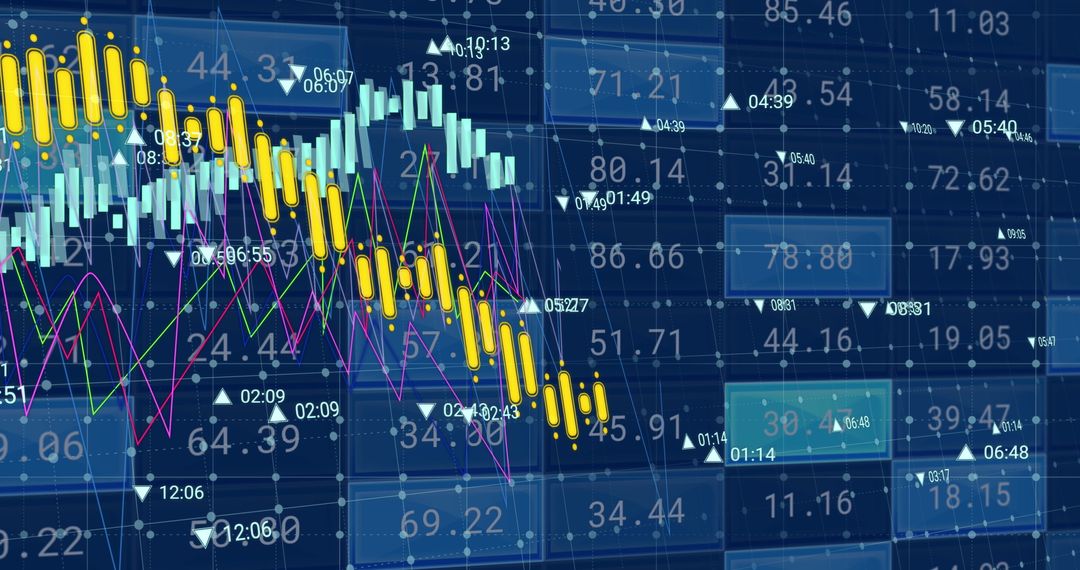
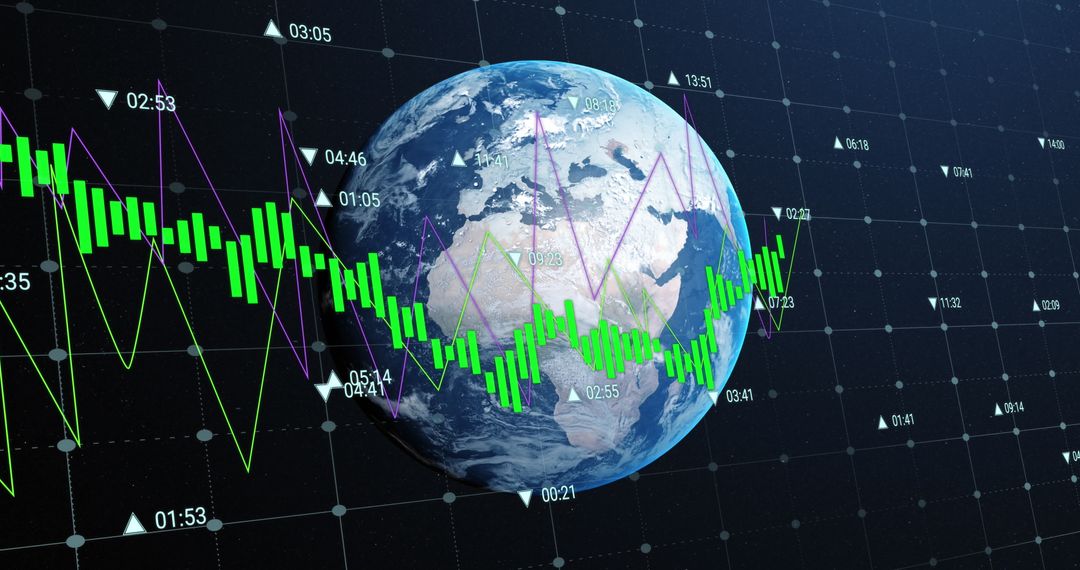
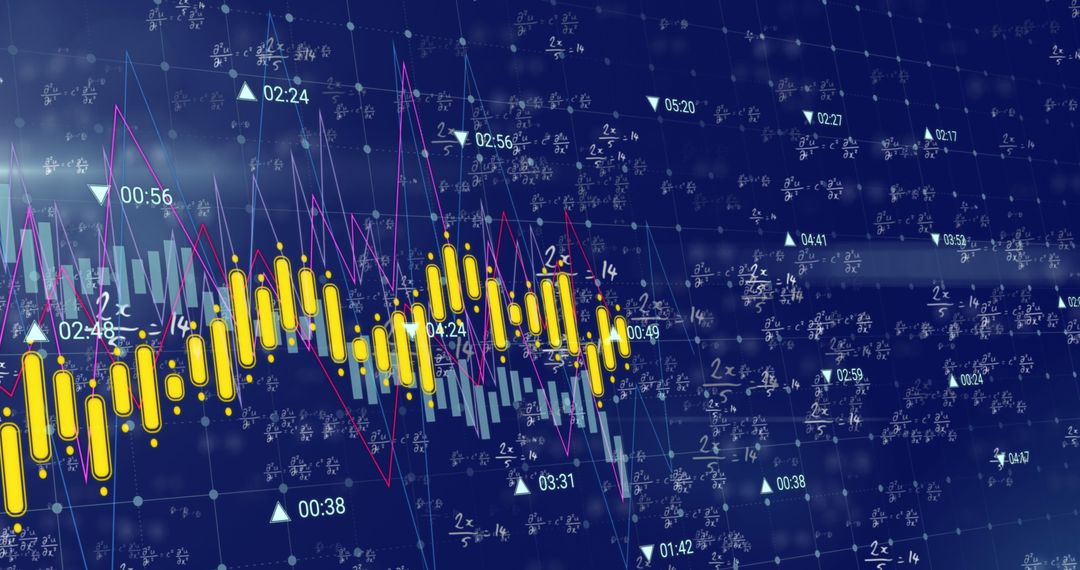
- Tracking Global Markets with Neon Candlestick Arc, Line Graphs, Globe and Ticker Data
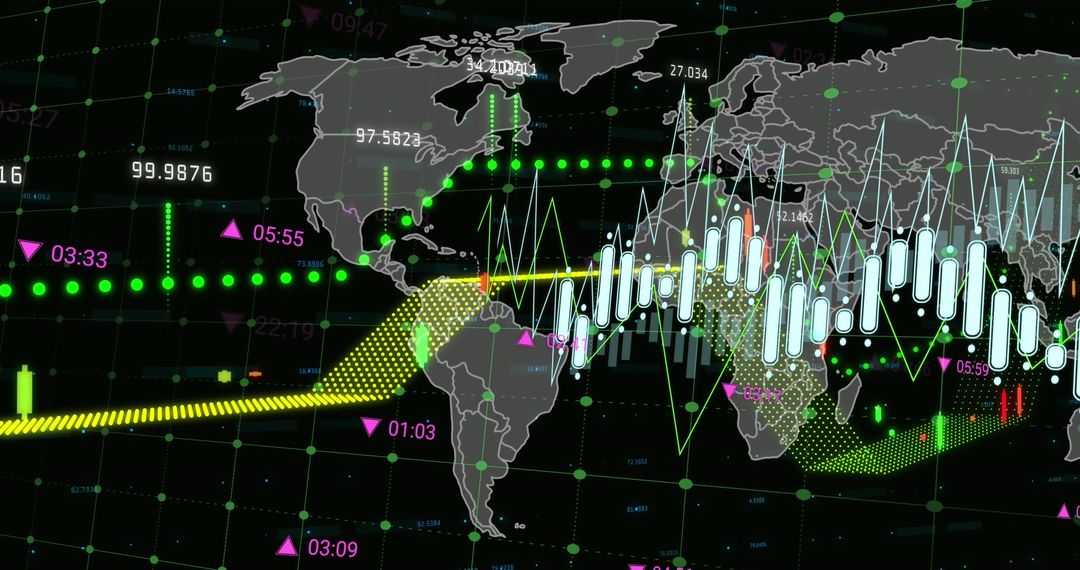
Tracking Global Markets with Neon Candlestick Arc, Line Graphs, Globe and Ticker Data Image

Featuring white-teal candlestick arc, layered line graphs, glowing globe and scrolling stock tickers on dark tech background. Conveying market volatility, trading momentum and real-time analytics with neon highlights and high contrast. Ideal for fintech websites, trading platform headers, financial reports, market analysis articles, investor presentations, social media ads, data science blogs and pitch decks. Suggesting cutting-edge finance technology, algorithmic trading and global market connectivity. Recommending use for hero banners, website backgrounds, slide covers, blog headers, newsletter headers and ad creatives. Advising cropping for banner and mobile formats, adding overlay text and key metrics for customization. Providing high visual impact for editorial and commercial projects.
Powered by  - Get 15% off with code: PIKWIZARD15


0
downloads
downloads
Tags:
More
Credit Photo
If you would like to credit the Photo, here are some ways you can do so
Text Link
photo Link
<span class="text-link">
<span>
<a target="_blank" href=https://pikwizard.com/photo/tracking-global-markets-with-neon-candlestick-arc-line-graphs-globe-and-ticker-data/6aeec4ae21a0457160c9e2fed529561e/>PikWizard</a>
</span>
</span>
<span class="image-link">
<span
style="margin: 0 0 20px 0; display: inline-block; vertical-align: middle; width: 100%;"
>
<a
target="_blank"
href="https://pikwizard.com/photo/tracking-global-markets-with-neon-candlestick-arc-line-graphs-globe-and-ticker-data/6aeec4ae21a0457160c9e2fed529561e/"
style="text-decoration: none; font-size: 10px; margin: 0;"
>
<img src="https://pikwizard.com/pw/medium/6aeec4ae21a0457160c9e2fed529561e.jpg" style="margin: 0; width: 100%;" alt="" />
<p style="font-size: 12px; margin: 0;">PikWizard</p>
</a>
</span>
</span>
Free (free of charge)
Free for personal and commercial use.
Author: People Creations
Similar Free Stock Images

Premium


Premium


Premium


Premium


Premium


Premium


Premium


Premium


Premium


Premium


Premium


Premium


Premium


Premium


Premium


Premium


Premium


Premium


Premium


Premium


Premium


Premium


Premium


Premium