- Home >
- Stock Photos >
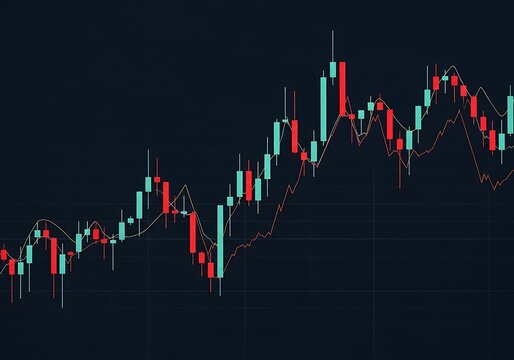
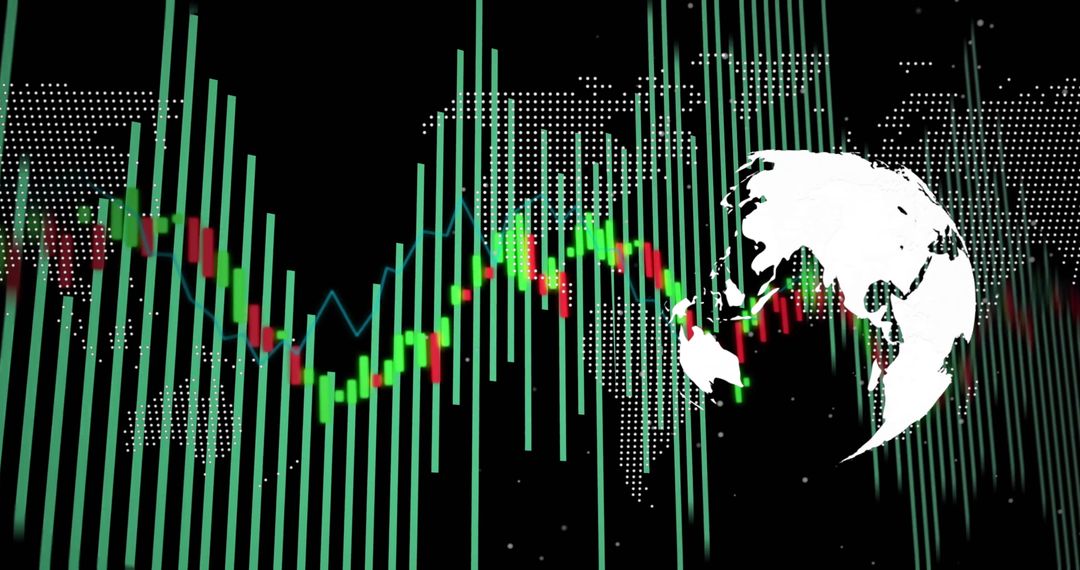
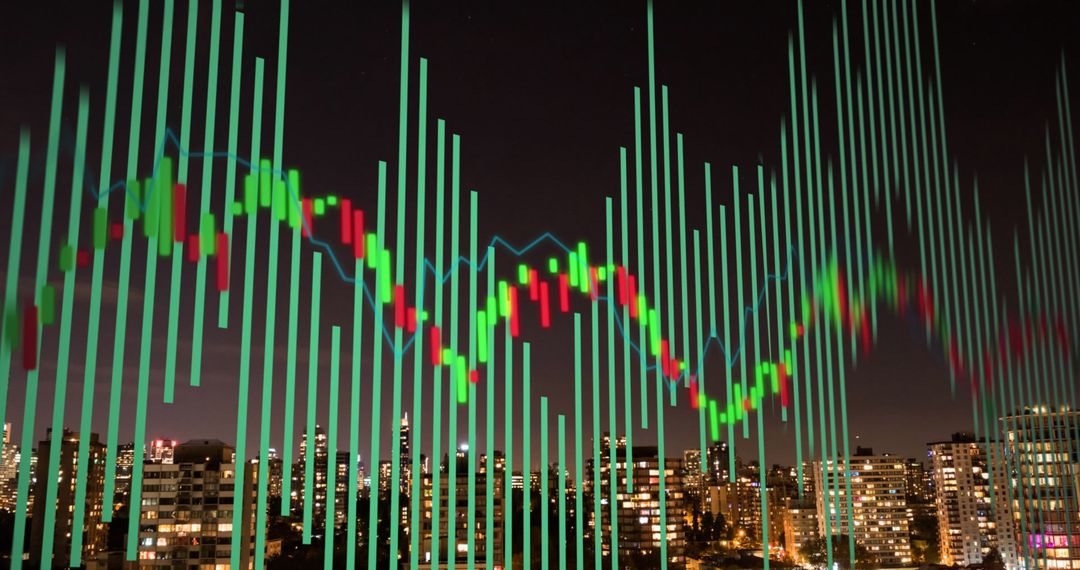
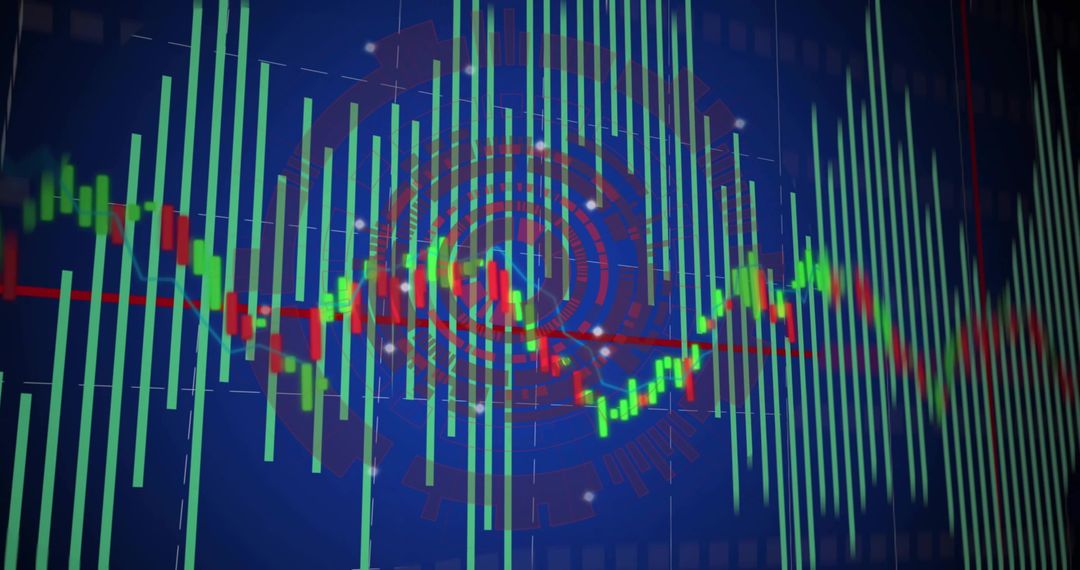
- Tracking Market Trends with Candlestick Chart Featuring Green Volume Bars and Blue MA Line
Tracking Market Trends with Candlestick Chart Featuring Green Volume Bars and Blue MA Line Image

Dark trading screen showing candlestick price action with alternating green and red candles, tall green vertical volume bars, and blue moving average line tracking trend. High contrast color palette creating modern financial tech look suitable for fintech and trading brands. Useful for illustrating market volatility, technical analysis, trading strategies, price movement explanations, or finance news. Ideal for website hero banners, blog headers, trading platform UI mockups, investor presentations, financial reports, social media posts promoting trading tools. Cropping or overlaying text working well with center composition and negative space for headline placement.
Powered by 


0
downloads
downloads
Tags:
More
Credit Photo
If you would like to credit the Photo, here are some ways you can do so
Text Link
photo Link
<span class="text-link">
<span>
<a target="_blank" href=https://pikwizard.com/photo/tracking-market-trends-with-candlestick-chart-featuring-green-volume-bars-and-blue-ma-line/3d6cdecc41eeb2086dd79859c9eee496/>PikWizard</a>
</span>
</span>
<span class="image-link">
<span
style="margin: 0 0 20px 0; display: inline-block; vertical-align: middle; width: 100%;"
>
<a
target="_blank"
href="https://pikwizard.com/photo/tracking-market-trends-with-candlestick-chart-featuring-green-volume-bars-and-blue-ma-line/3d6cdecc41eeb2086dd79859c9eee496/"
style="text-decoration: none; font-size: 10px; margin: 0;"
>
<img src="https://pikwizard.com/pw/medium/3d6cdecc41eeb2086dd79859c9eee496.jpg" style="margin: 0; width: 100%;" alt="" />
<p style="font-size: 12px; margin: 0;">PikWizard</p>
</a>
</span>
</span>
Free (free of charge)
Free for personal and commercial use.
Author: Creative Art
Similar Free Stock Images

Premium


Premium


Premium


Premium


Premium


Premium


Premium


Premium


Premium


Premium


Premium


Premium


Premium


Premium


Premium


Premium


Premium


Premium


Premium


Premium


Premium


Premium


Premium


Premium