
- Home >
- Stock Photos >
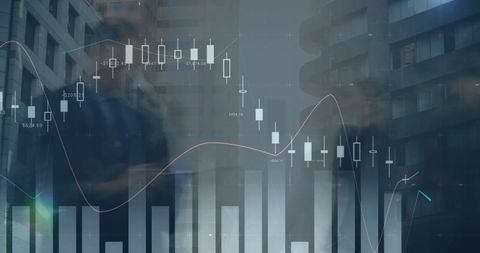
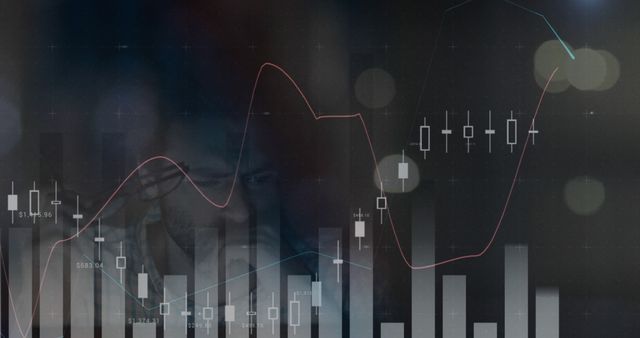
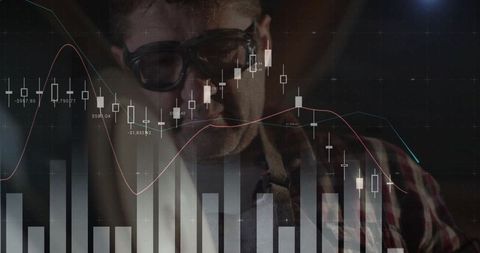
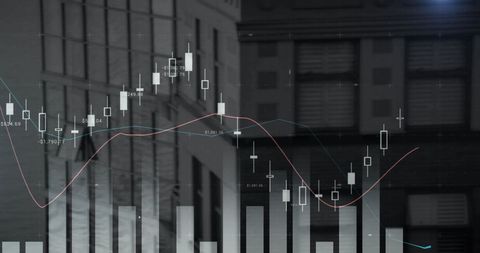
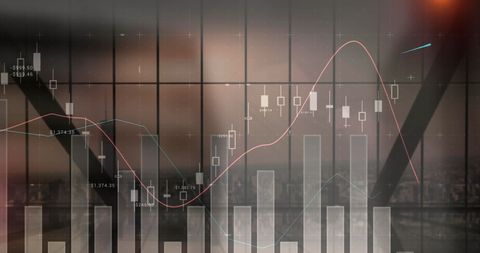
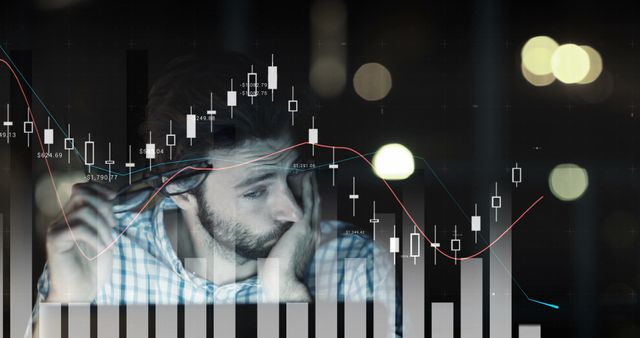
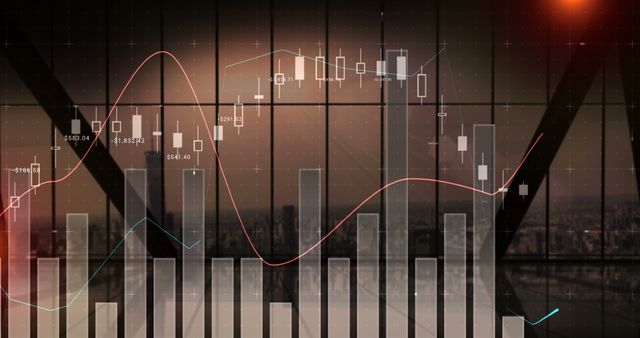
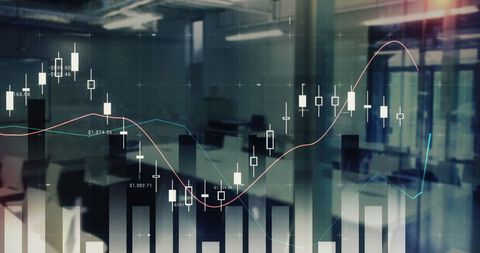
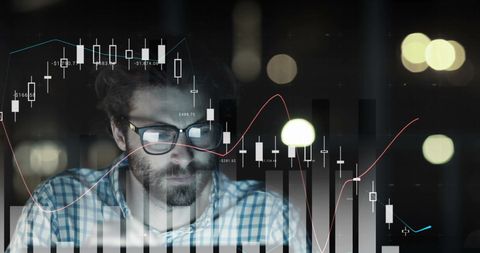
- Trader Analyzing Dynamic Digital Candlestick Chart
Trader Analyzing Dynamic Digital Candlestick Chart Image

Displays a trader adjusting a digital candlestick chart with a red trend line, showcasing interaction between technology and finance. Suitable for use in financial technology presentations, service promotions in analytics and investment, or alongside articles detailing futuristic approaches to market trading.
Powered by  - Get 15% off with code: PIKWIZARD15


downloads
Tags:
More
Credit Photo
If you would like to credit the Photo, here are some ways you can do so
Text Link
photo Link
<span class="text-link">
<span>
<a target="_blank" href=https://pikwizard.com/photo/trader-analyzing-dynamic-digital-candlestick-chart/1f03fdde9f1a2ff6812f2b86049998a2/>PikWizard</a>
</span>
</span>
<span class="image-link">
<span
style="margin: 0 0 20px 0; display: inline-block; vertical-align: middle; width: 100%;"
>
<a
target="_blank"
href="https://pikwizard.com/photo/trader-analyzing-dynamic-digital-candlestick-chart/1f03fdde9f1a2ff6812f2b86049998a2/"
style="text-decoration: none; font-size: 10px; margin: 0;"
>
<img src="https://pikwizard.com/pw/medium/1f03fdde9f1a2ff6812f2b86049998a2.jpg" style="margin: 0; width: 100%;" alt="" />
<p style="font-size: 12px; margin: 0;">PikWizard</p>
</a>
</span>
</span>
Free (free of charge)
Free for personal and commercial use.
Author: Authentic Images
Similar Free Stock Images
Premium


Premium

Premium

Premium


Premium


Premium


Premium


Premium


Premium


Premium

Premium


Premium

Premium

Premium


Premium


Premium


Premium

Premium


Premium

Premium


Premium

Premium


Premium

Premium


Premium


Explore More Free Stock Images