- Home >
- Stock Photos >
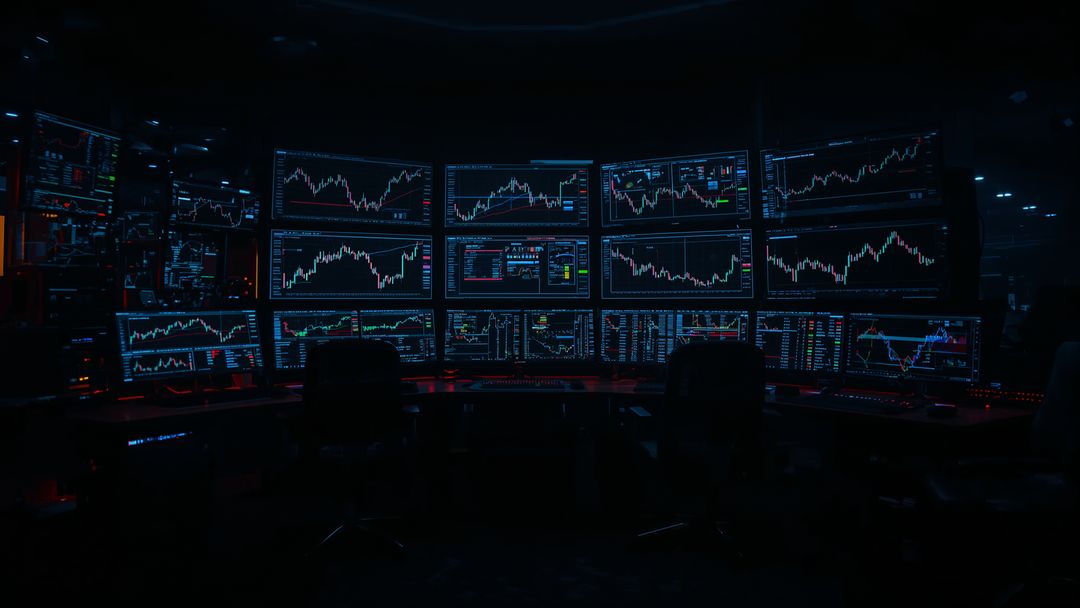
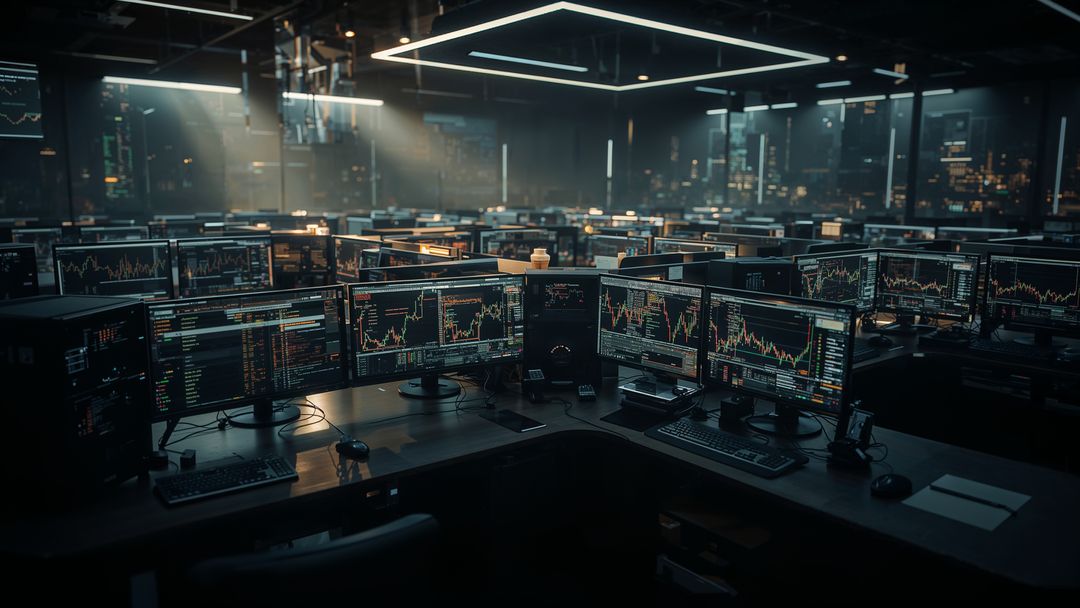
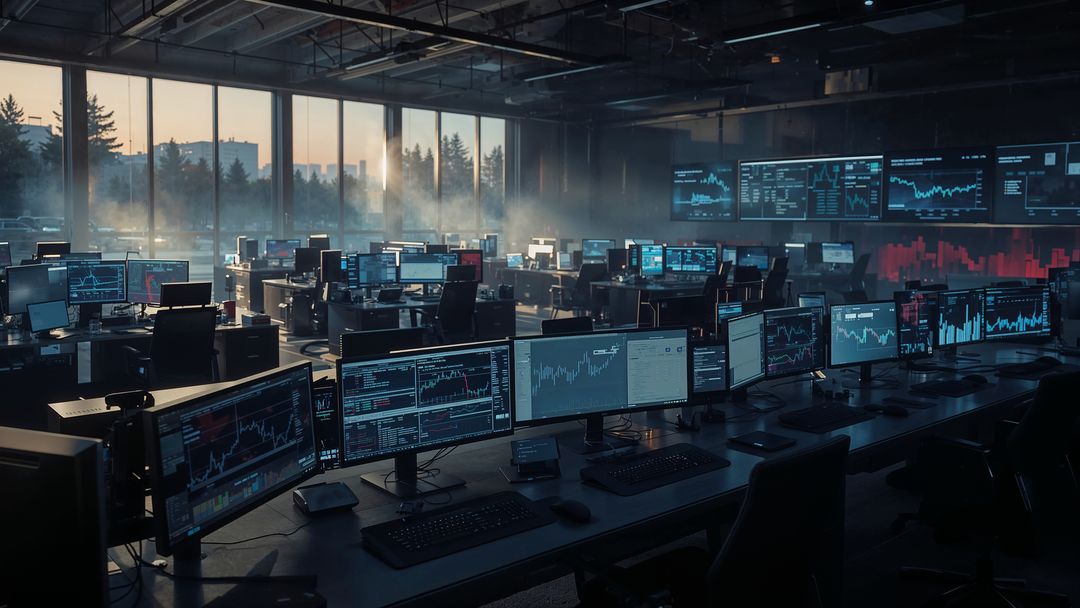
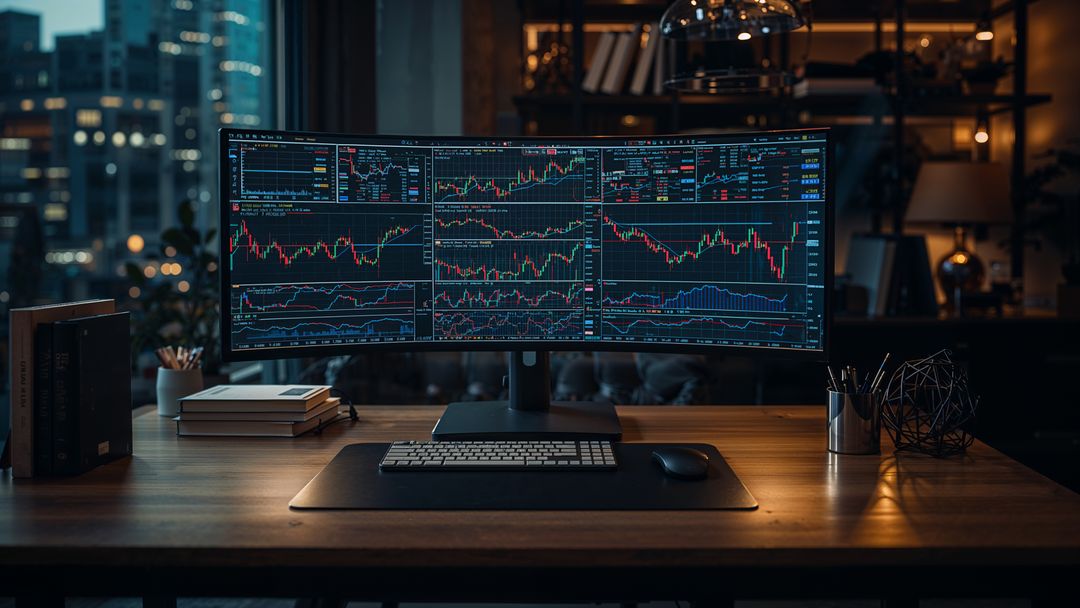
- Trader Analyzing Stock Charts in Dark Trading Room
Trader Analyzing Stock Charts in Dark Trading Room Image
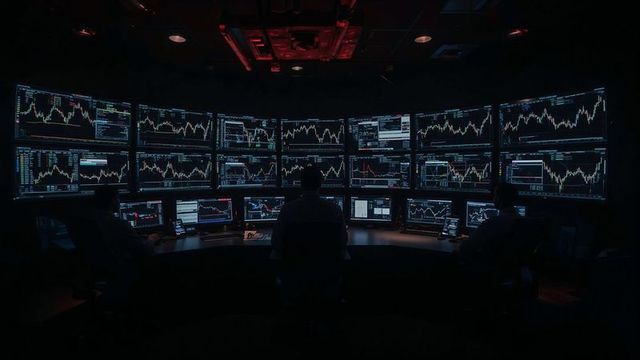
AI Generated Image. Used for content concerning finance, stock trading, or business analytics. Ideal for articles on market trends, financial technology, or professional analysis environments. Highlights modern trading capability and analytics.
Powered by  - Get 15% off with code: PIKWIZARD15


0
downloads
downloads
Tags:
More
Credit Photo
If you would like to credit the Photo, here are some ways you can do so
Text Link
photo Link
<span class="text-link">
<span>
<a target="_blank" href=https://pikwizard.com/photo/trader-analyzing-stock-charts-in-dark-trading-room/c89547ca36daad7c1794bb40c1f90054/>PikWizard</a>
</span>
</span>
<span class="image-link">
<span
style="margin: 0 0 20px 0; display: inline-block; vertical-align: middle; width: 100%;"
>
<a
target="_blank"
href="https://pikwizard.com/photo/trader-analyzing-stock-charts-in-dark-trading-room/c89547ca36daad7c1794bb40c1f90054/"
style="text-decoration: none; font-size: 10px; margin: 0;"
>
<img src="https://pikwizard.com/pw/medium/c89547ca36daad7c1794bb40c1f90054.jpg" style="margin: 0; width: 100%;" alt="" />
<p style="font-size: 12px; margin: 0;">PikWizard</p>
</a>
</span>
</span>
Free (free of charge)
Free for personal and commercial use.
Author: AI Creator
Similar Free Stock Images

Premium


Premium


Premium


Premium


Premium


Premium


Premium


Premium


Premium


Premium


Premium


Premium


Premium


Premium


Premium


Premium


Premium


Premium


Premium


Premium


Premium


Premium


Premium


Premium