- Home >
- Stock Photos >
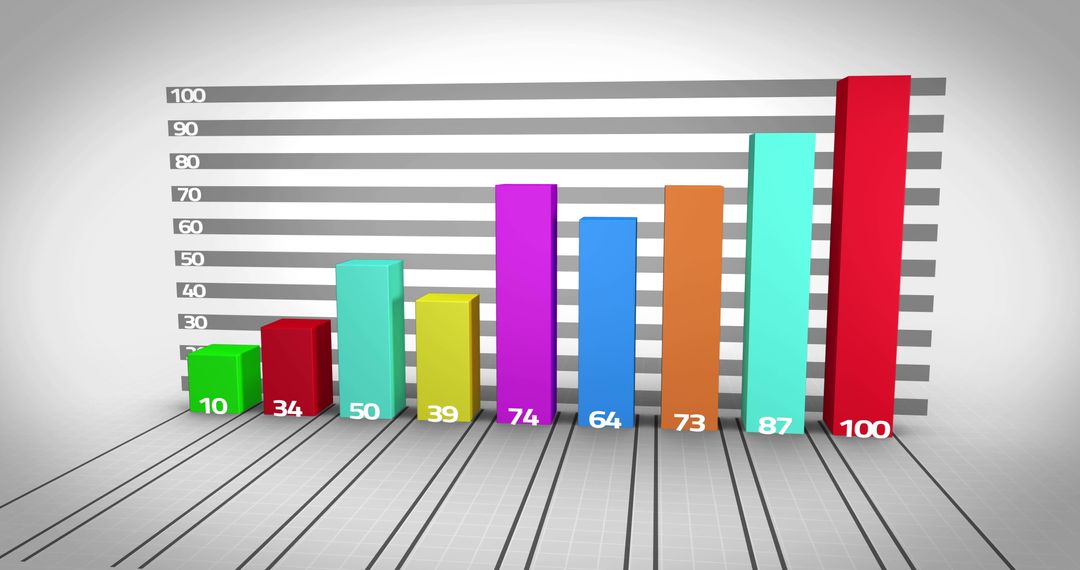
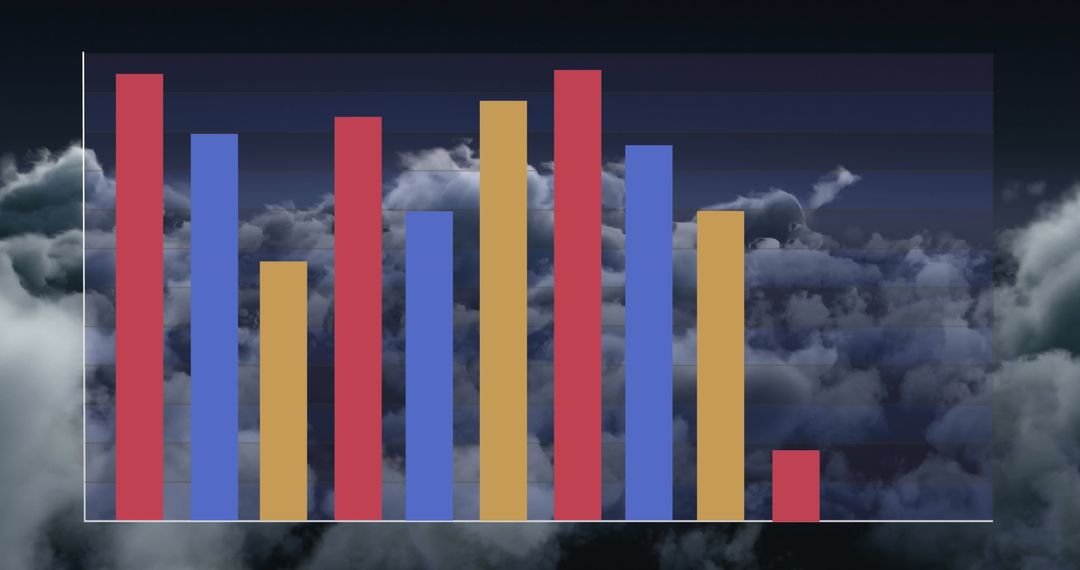
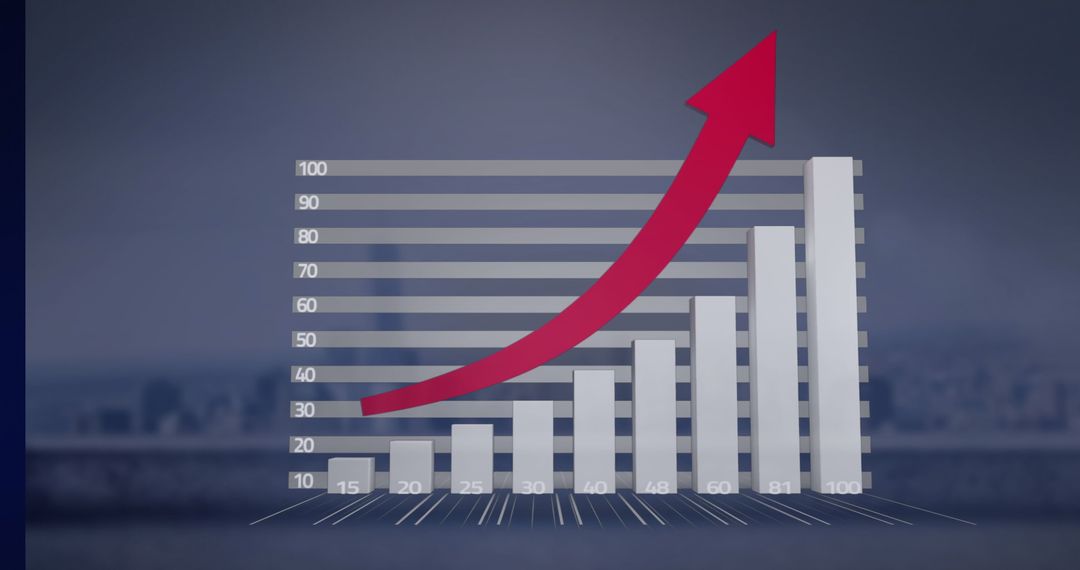
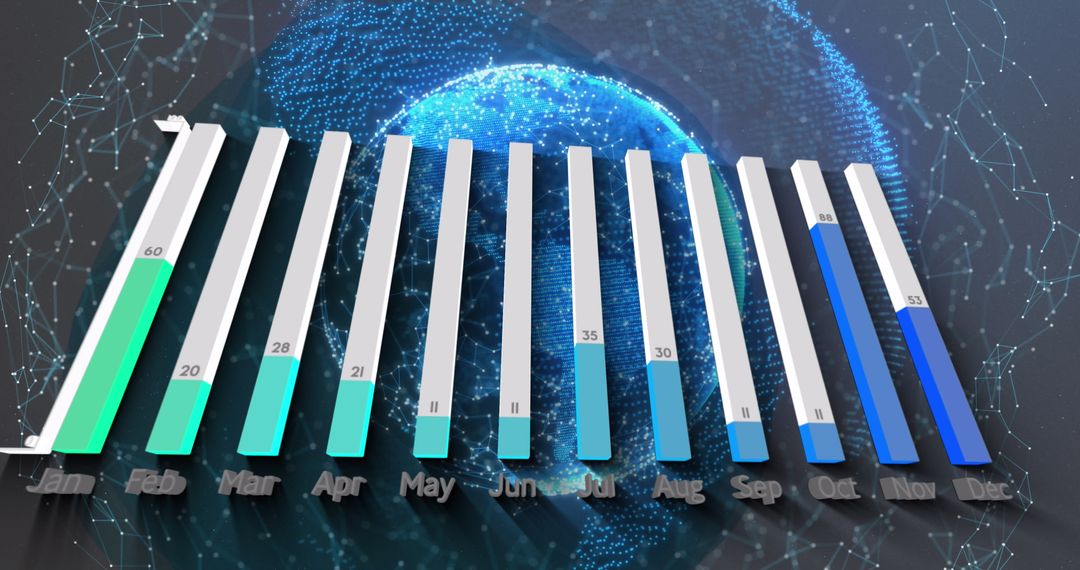
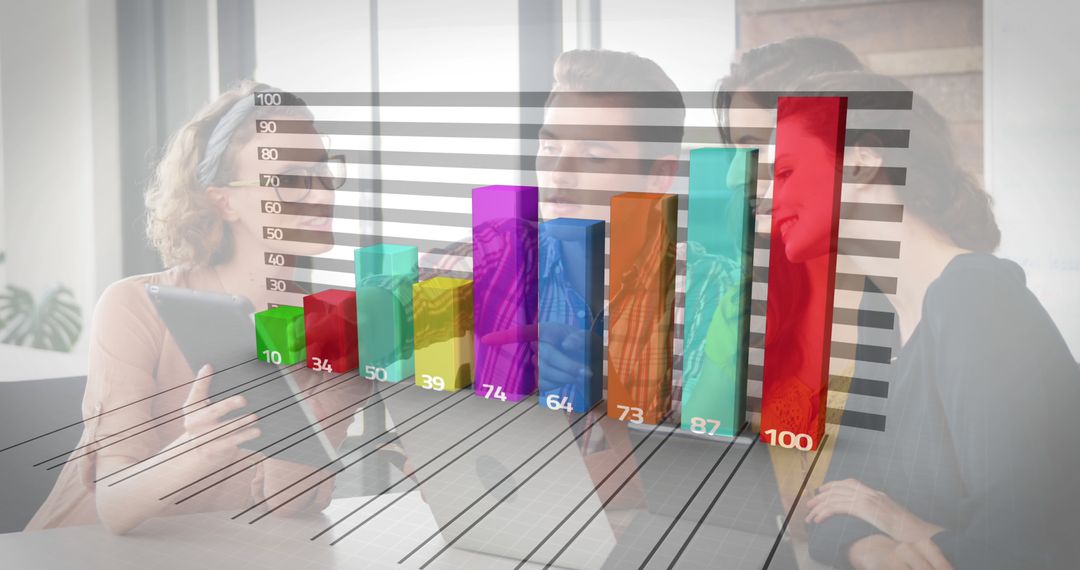
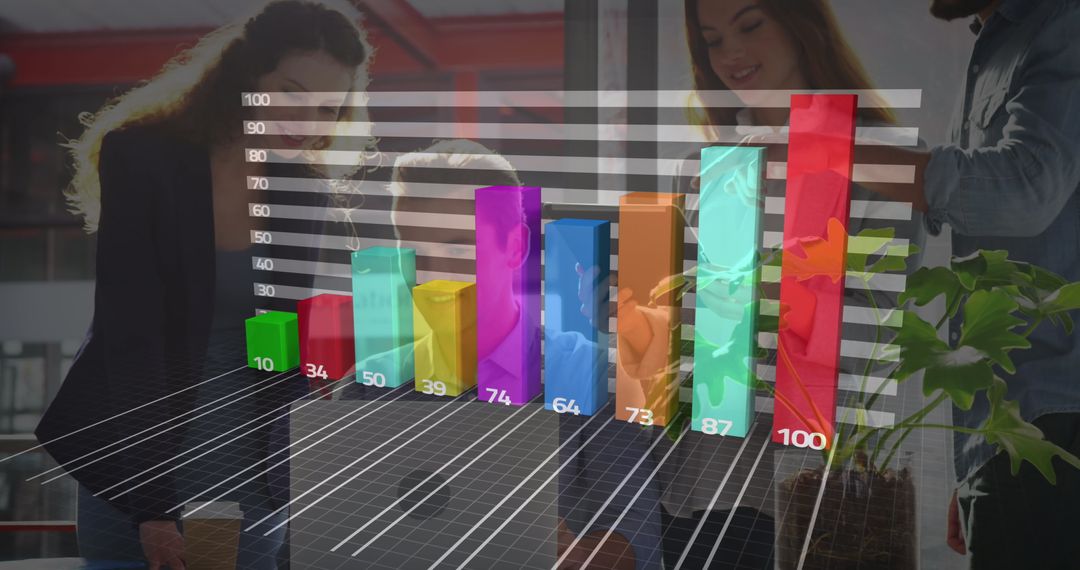
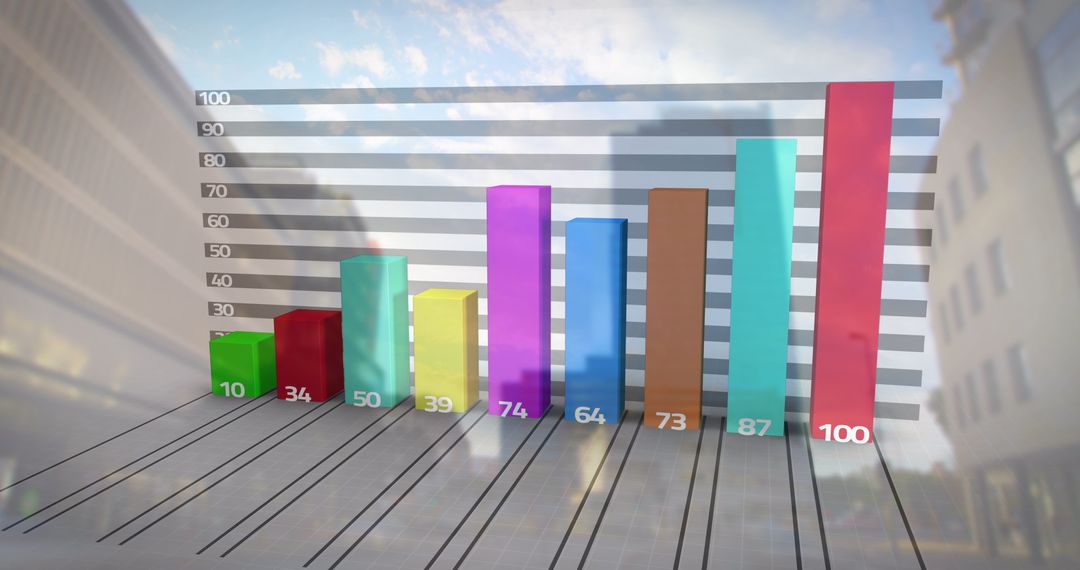
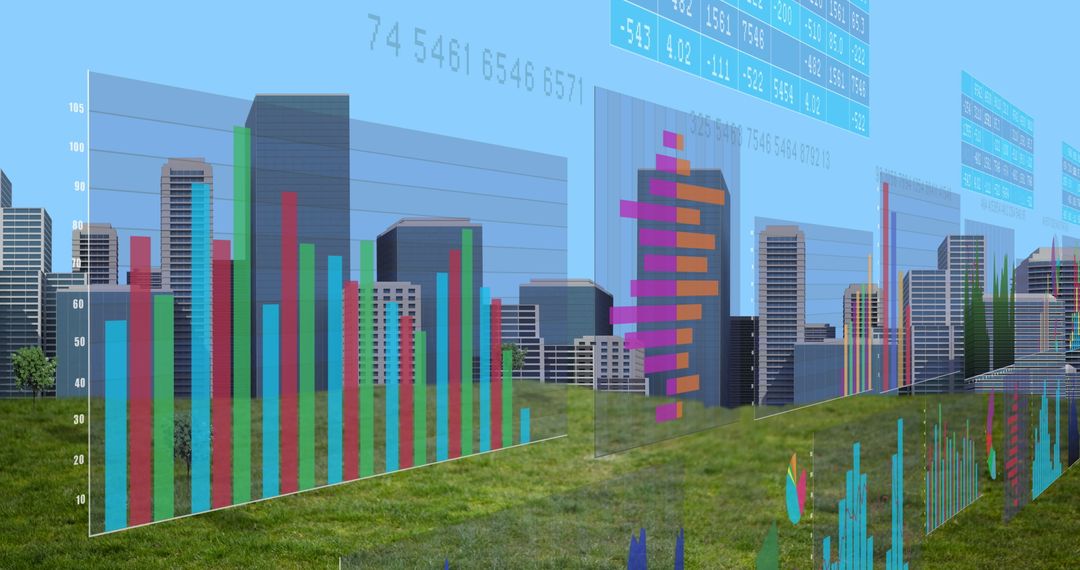
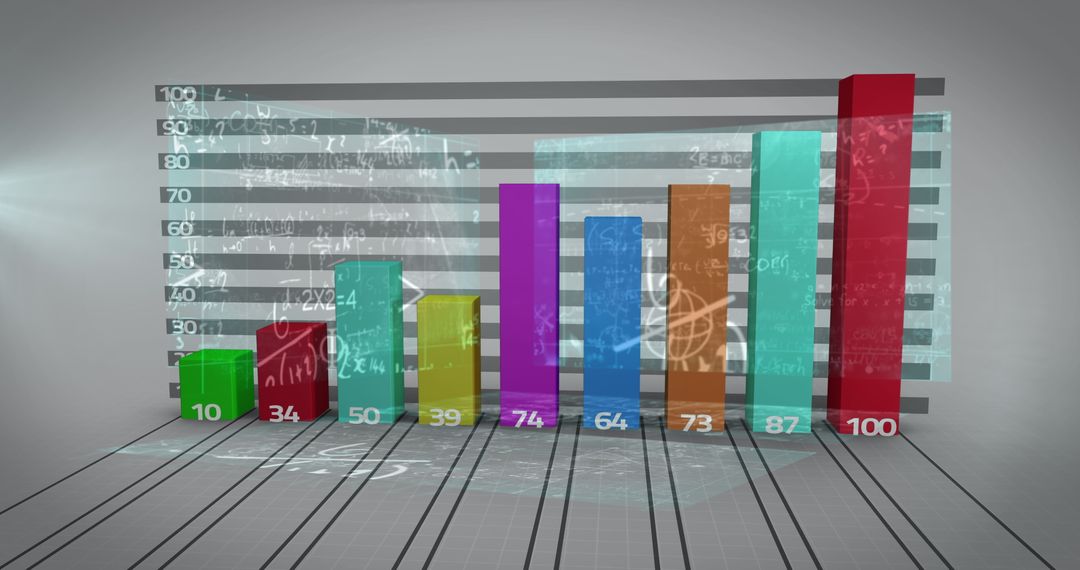
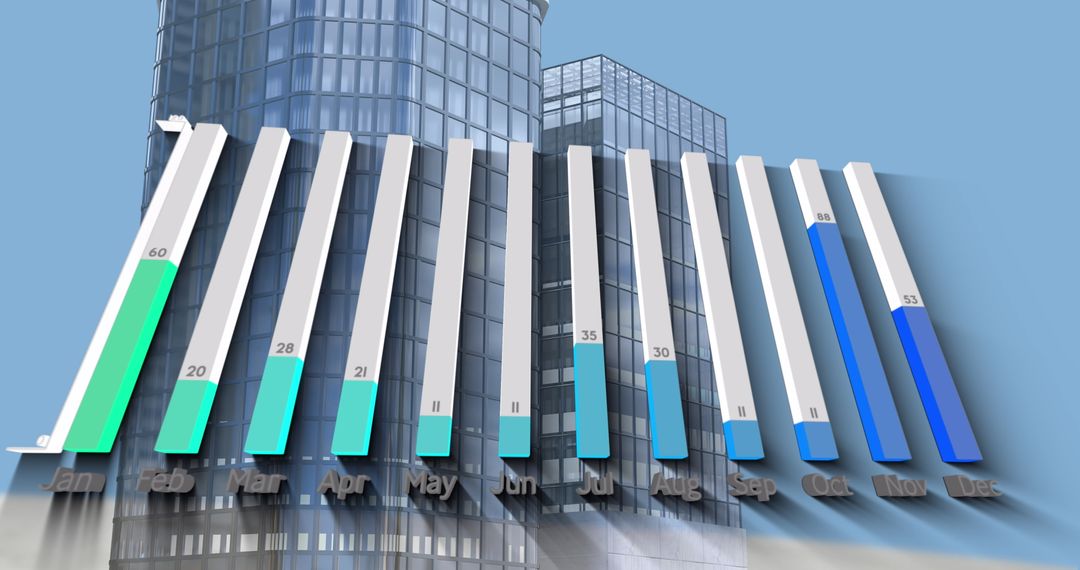
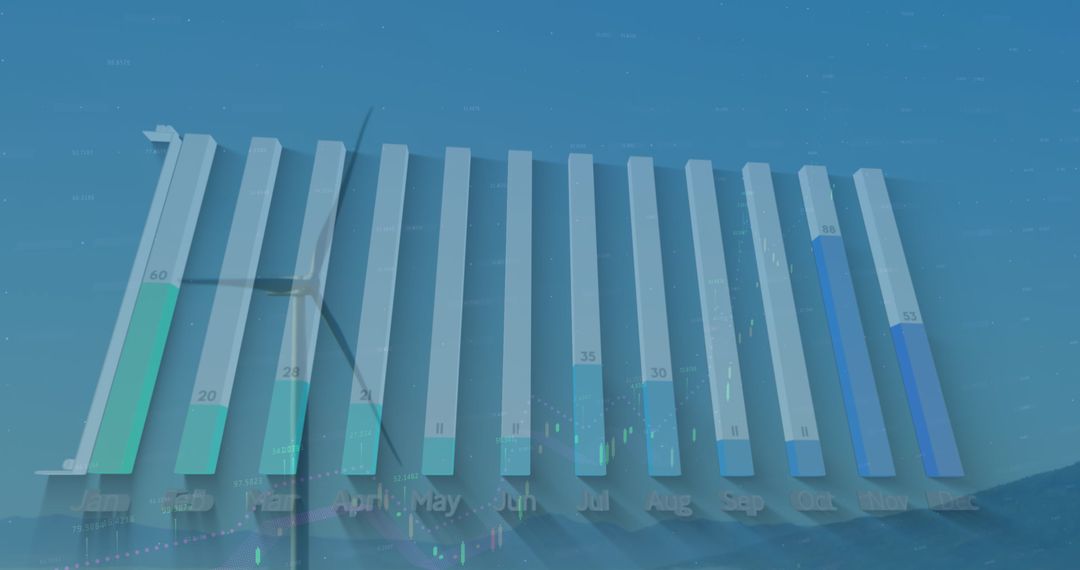
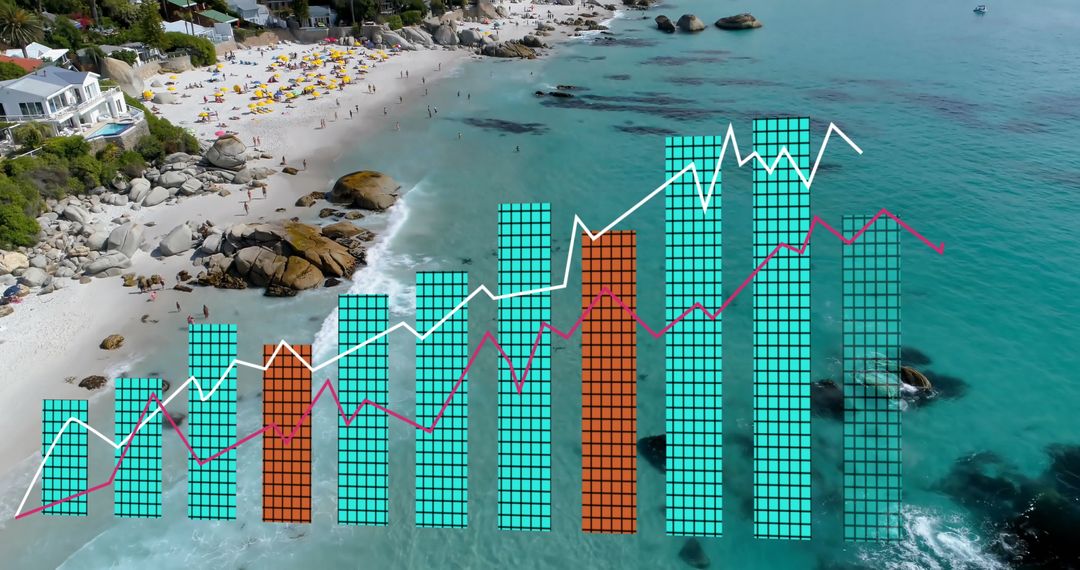
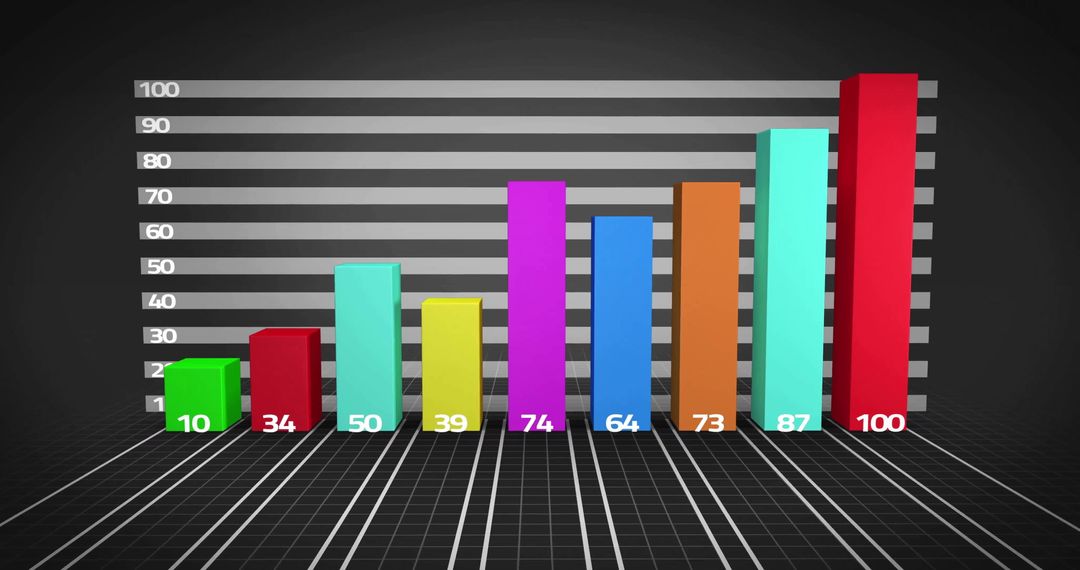
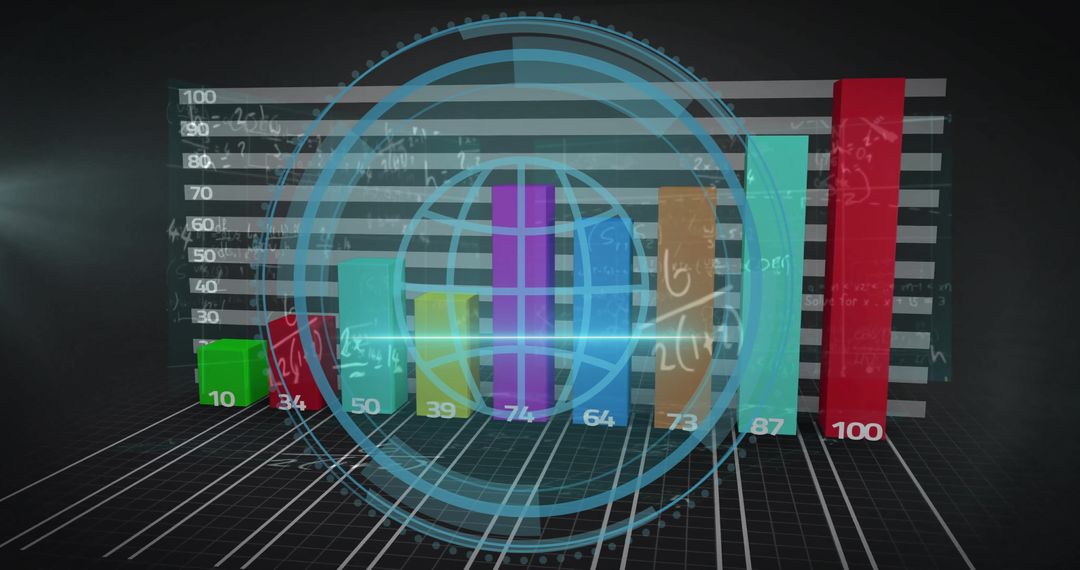
- Translucent 3D Bar Graph on Coastal Shoreline Background
Translucent 3D Bar Graph on Coastal Shoreline Background Image
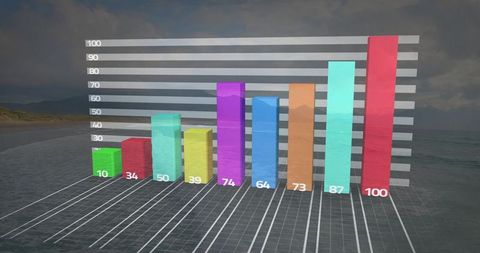
This image showcases a modern translucent 3D bar graph with nine colored bars set against a coastal shoreline. The overlay of data visualization creates a dynamic and environmentally aware visual, perfect for presentations, business reports, or digital interfaces in analytics and business intelligence. Ideal for illustrating concepts in marketing, statistical reports, or educational material focused on market trends and environmental comparisons.
Powered by 


0
downloads
downloads
Tags:
More
Credit Photo
If you would like to credit the Photo, here are some ways you can do so
Text Link
photo Link
<span class="text-link">
<span>
<a target="_blank" href=https://pikwizard.com/photo/translucent-3d-bar-graph-on-coastal-shoreline-background/acfeaf4f72a9a957ac4d9d541f81d928/>PikWizard</a>
</span>
</span>
<span class="image-link">
<span
style="margin: 0 0 20px 0; display: inline-block; vertical-align: middle; width: 100%;"
>
<a
target="_blank"
href="https://pikwizard.com/photo/translucent-3d-bar-graph-on-coastal-shoreline-background/acfeaf4f72a9a957ac4d9d541f81d928/"
style="text-decoration: none; font-size: 10px; margin: 0;"
>
<img src="https://pikwizard.com/pw/medium/acfeaf4f72a9a957ac4d9d541f81d928.jpg" style="margin: 0; width: 100%;" alt="" />
<p style="font-size: 12px; margin: 0;">PikWizard</p>
</a>
</span>
</span>
Free (free of charge)
Free for personal and commercial use.
Author: Awesome Content
Similar Free Stock Images
Premium

Premium

Premium


Premium


Premium


Premium


Premium


Premium


Premium


Premium


Premium


Premium


Premium


Premium


Premium


Premium


Premium


Premium


Premium


Premium


Premium


Premium


Premium


Premium