
- Home >
- Stock Photos >
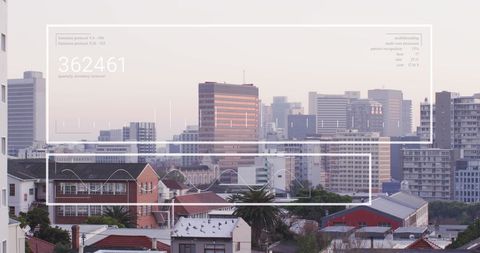
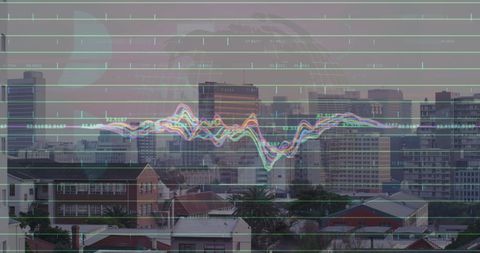
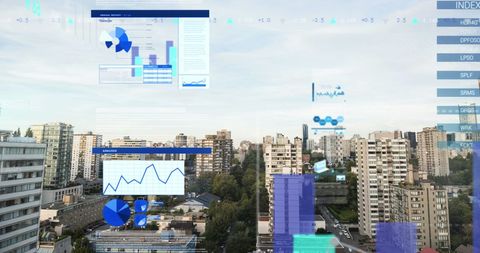
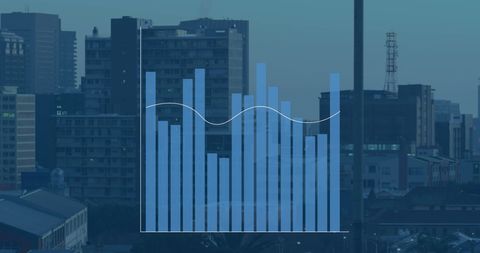
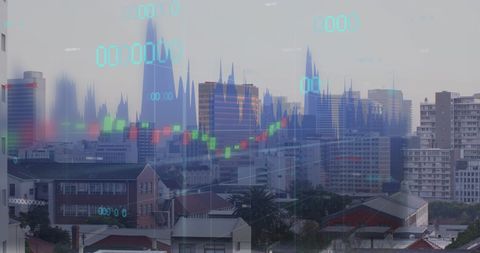
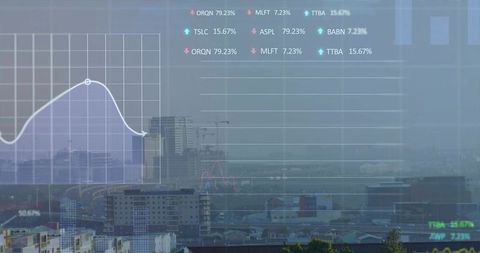
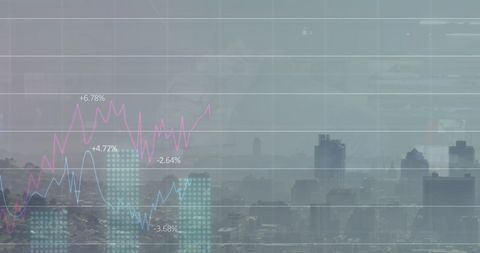
- Translucent Data Chart Overlay on Urban Cityscape
Translucent Data Chart Overlay on Urban Cityscape Image
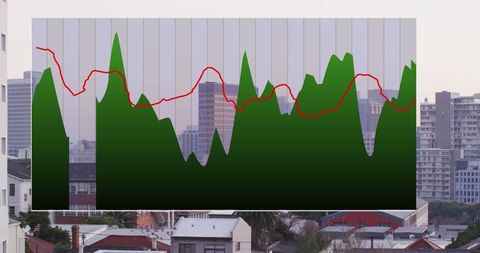
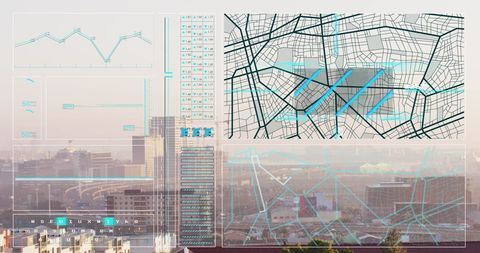
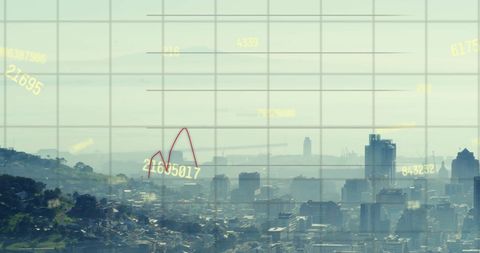
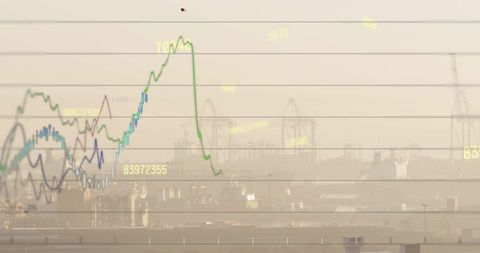
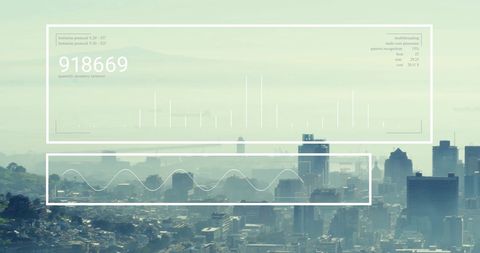
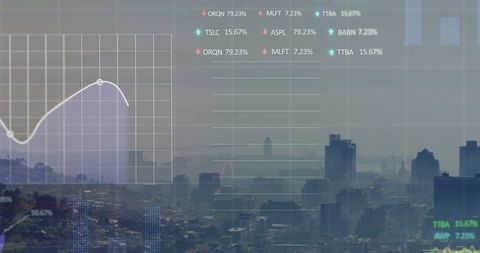
This image blends a translucent data chart with a cityscape, capturing urban analytics in a visually appealing form. The red line and green areas represent statistical data, ideal for use in articles about urban studies, modern technology, or data analysis. It is suitable for illustrating concepts related to data-driven innovation or city infrastructure projects.
Powered by  - Get 15% off with code: PIKWIZARD15


downloads
Tags:
More
Credit Photo
If you would like to credit the Photo, here are some ways you can do so
Text Link
photo Link
<span class="text-link">
<span>
<a target="_blank" href=https://pikwizard.com/photo/translucent-data-chart-overlay-on-urban-cityscape/d5659cf33ad84395f66d9aaf95699bc3/>PikWizard</a>
</span>
</span>
<span class="image-link">
<span
style="margin: 0 0 20px 0; display: inline-block; vertical-align: middle; width: 100%;"
>
<a
target="_blank"
href="https://pikwizard.com/photo/translucent-data-chart-overlay-on-urban-cityscape/d5659cf33ad84395f66d9aaf95699bc3/"
style="text-decoration: none; font-size: 10px; margin: 0;"
>
<img src="https://pikwizard.com/pw/medium/d5659cf33ad84395f66d9aaf95699bc3.jpg" style="margin: 0; width: 100%;" alt="" />
<p style="font-size: 12px; margin: 0;">PikWizard</p>
</a>
</span>
</span>
Free (free of charge)
Free for personal and commercial use.
Author: People Creations
Similar Free Stock Images

Premium


Premium

Premium


Premium


Premium


Premium


Premium


Premium

Premium

Premium

Premium


Premium


Premium


Premium


Premium


Premium


Premium


Premium


Premium


Premium


Premium

Premium


Premium


Premium


Premium


Explore More Free Stock Images