- Home >
- Stock Photos >
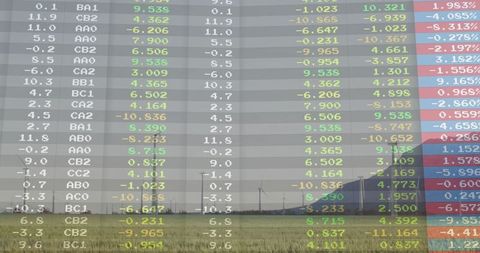
- Translucent Data Table on Dynamic Digital Dashboard Background
Translucent Data Table on Dynamic Digital Dashboard Background Image
Translucent data table overlays on a red scrolling stock market ticker. Suitable for illustrating financial analysis, stock market trends, or data visualization topics. Useful for websites and presentations related to finance, economics, or technology.

downloads
Tags:
More
Credit Photo
If you would like to credit the Photo, here are some ways you can do so
Text Link
photo Link
<span class="text-link">
<span>
<a target="_blank" href=https://pikwizard.com/photo/translucent-data-table-on-dynamic-digital-dashboard-background/b3bccde91a93a8a2660e2515b9981698/>PikWizard</a>
</span>
</span>
<span class="image-link">
<span
style="margin: 0 0 20px 0; display: inline-block; vertical-align: middle; width: 100%;"
>
<a
target="_blank"
href="https://pikwizard.com/photo/translucent-data-table-on-dynamic-digital-dashboard-background/b3bccde91a93a8a2660e2515b9981698/"
style="text-decoration: none; font-size: 10px; margin: 0;"
>
<img src="https://pikwizard.com/pw/medium/b3bccde91a93a8a2660e2515b9981698.jpg" style="margin: 0; width: 100%;" alt="" />
<p style="font-size: 12px; margin: 0;">PikWizard</p>
</a>
</span>
</span>
Free (free of charge)
Free for personal and commercial use.
Author: People Creations