
- Home >
- Free Stock Photos & Images >
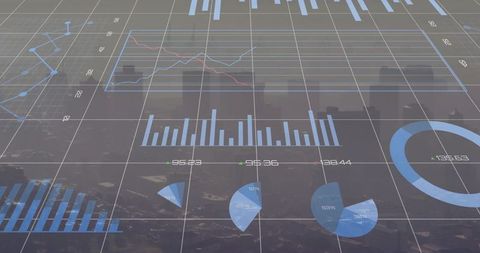
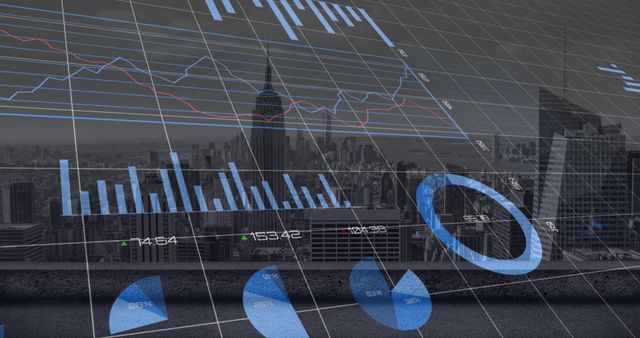
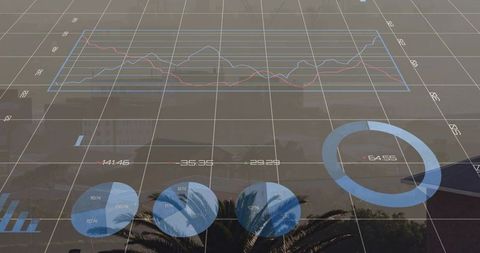
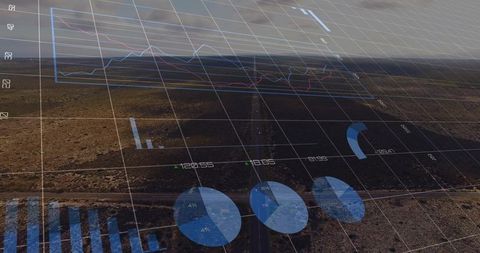
- Translucent Data Visualization Overlay Projecting Analytics Over Industrial Port
Translucent Data Visualization Overlay Projecting Analytics Over Industrial Port Free Stock Image
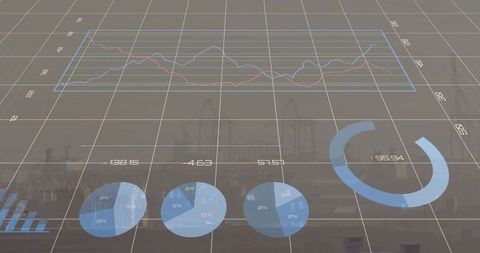
Showing translucent data readouts and charts overlaying industrial port silhouette with grid plane, line graphs, pie charts and ring chart. Featuring cool blue tones, semi-transparent overlays and muted industrial palette for modern technical aesthetic. Ideal for illustrating logistics analytics, enhancing supply chain dashboards, communicating port performance metrics and supporting maritime technology presentations. Working well for website banners, slide decks, annual reports, marketing collateral and editorial layouts needing conceptual visualization of data-driven industry. Editable for overlaying custom metrics, branding colors and headline text.
Powered by  - Get 15% off with code: PIKWIZARD15


downloads
Tags:
More
Credit Photo
If you would like to credit the Photo, here are some ways you can do so
Text Link
photo Link
<span class="text-link">
<span>
<a target="_blank" href=https://pikwizard.com/photo/translucent-data-visualization-overlay-projecting-analytics-over-industrial-port/e9969ca742743456faa8026d6d87d34d/>PikWizard</a>
</span>
</span>
<span class="image-link">
<span
style="margin: 0 0 20px 0; display: inline-block; vertical-align: middle; width: 100%;"
>
<a
target="_blank"
href="https://pikwizard.com/photo/translucent-data-visualization-overlay-projecting-analytics-over-industrial-port/e9969ca742743456faa8026d6d87d34d/"
style="text-decoration: none; font-size: 10px; margin: 0;"
>
<img src="https://thumbs.wbm.im/pw/medium/e9969ca742743456faa8026d6d87d34d.jpg" style="margin: 0; width: 100%;" alt="Translucent Data Visualization Overlay Projecting Analytics Over Industrial Port" />
<p style="font-size: 12px; margin: 0;">PikWizard</p>
</a>
</span>
</span>
Free (free of charge)
Free for personal and commercial use.
Author: Awesome Content
Similar Free Stock Images


Premium


Premium


Premium


Premium


Premium


Premium


Premium


Premium


Premium


Premium


Premium


Premium


Premium


Premium


Premium


Premium


Premium


Premium


Premium


Premium


Premium


Premium


Premium


Premium


Premium

Explore More Free Stock Images