- Home >
- Stock Photos >
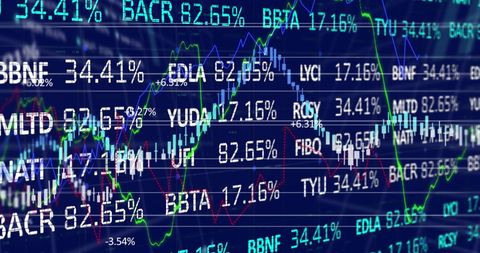
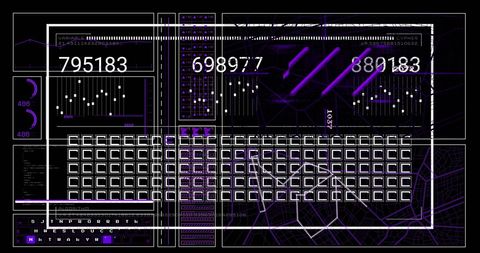
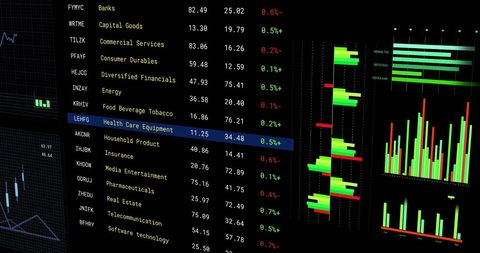
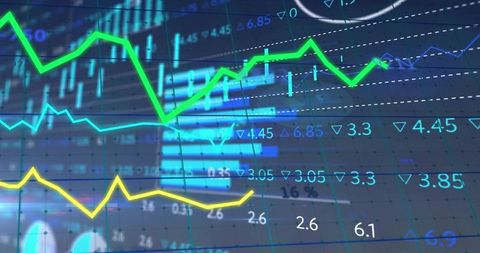
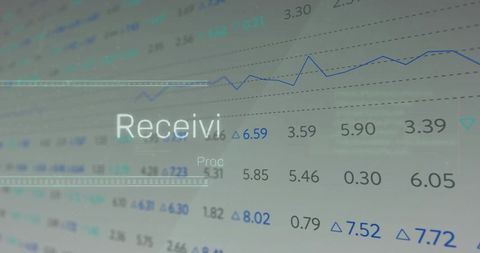
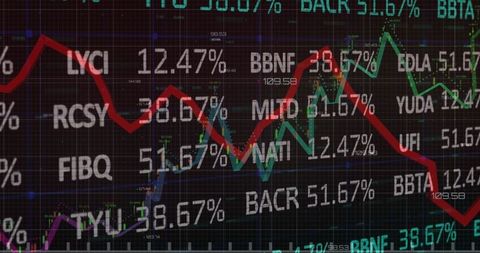
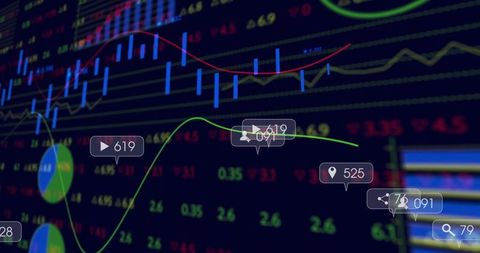
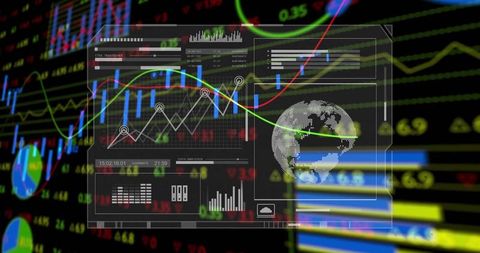
- Translucent Financial Dashboard Displaying Live Counters, Candlestick Charts, Market Analytics
Translucent Financial Dashboard Displaying Live Counters, Candlestick Charts, Market Analytics Image
Displaying translucent white-framed dashboard overlaying blurred stock ticker background, featuring three large numeric counters, candlestick bars, colored trend lines (green and red), and grid of small data tiles. Presenting algorithmic readouts and waveform markers, conveying high-tech trading environment and real-time analytics. Serving as visual asset for fintech projects, enhancing website hero banners, supporting blog headers about market trends and trading strategies, complementing investor presentations and pitch decks, illustrating reports on algorithmic trading and quantitative analysis, and enriching marketing materials for trading platforms and financial software. Allowing easy cropping for banner or hero use, providing clear focal area for headline and call-to-action.

downloads
Credit Photo
If you would like to credit the Photo, here are some ways you can do so
Free (free of charge)
Free for personal and commercial use.
Author: Authentic Images