1. Home > 
  2. Stock Photos > 
  3. Translucent Financial Data Overlay in Natural Setting

Translucent Financial Data Overlay in Natural Setting Image

Translucent Financial Data Overlay in Natural Setting

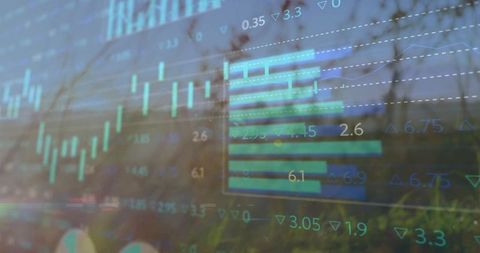
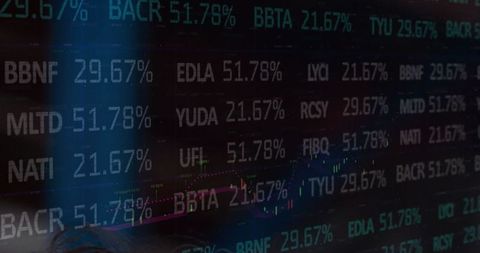
Juxtaposing financial data with nature, this image merges digital finance elements like candlestick charts and grid lines with a subtle view of the meadow behind. It's perfect for illustrating topics related to financial technology in harmony with nature, eco-friendly finance solutions, and digital analytics. Use this for websites, blogs, or presentations on finance, investment, and green technological approaches.

Powered by Adobe logo
Global Market Trends and Financial Data Visualization Merging with Urban Smart City Landscape. - Powered by AdobeGlobal financial trading chart with glowing blue bars and world map on digital interface background illustrating business data and economy concept. Ai generative - Powered by AdobeA focused individual analyzes digital financial data on a futuristic interface, highlighting trends and insights with a finger gesture. - Powered by AdobeColorful business analytics chart representing financial growth and data analysis
 - Powered by AdobeAbstract glowing bar chart symbolizing business growth and data analytics - Powered by Adobe

Credit Photo

If you would like to credit the Photo, here are some ways you can do so

Free (free of charge)

Free for personal and commercial use.

Author: People Creations

Similar Free Stock Images

Futuristic Financial Data Overlay on Night City Street
Premium
Visual representation of financial growth featuring upward charts and graphs, highlighting data trends in a digital environment focused on business success and investment strategies. Copula
Futuristic Data Analytics Overlooking Nighttime Cityscape
Premium
A dynamic visualization showcases financial growth with ascending graphs, lightbulbs, gears, and arrows.
Premium
Business analytics financial reports data visualization performance metrics corporate finance laptop workspace charts graphs statistics
Holographic Financial Data with Code Overlay
Team Analyzing Digital Financial Charts in Modern Conference Room
Businesspeople Overlaid with Financial Data and Binary Code
Cryptocurrency NFT Digital Art with Binary Coding and Statistics
Premium
Abstract financial data chart with glowing digital lines, futuristic stock market analytics background, big data visualization, blockchain economy, business growth and technology concept
America's Financial Landscape with Data and Analytics Overlay
Data Security Interface Monitoring Server Operations
Financial Professionals Analyzing Data on Growing Market Trends
Digital Finance Concept with Cityscape Background
Digital Stock Market Display Over Modern Cityscape
Financial Experts Analyzing Market Data in Modern Office
Global Financial Analytics: World Map with Market Data
Digital Financial Analytics Overlay on City Nightscape
Financial Data Analysis with Dynamic Trading Dashboard and Charts
Futuristic Analytics with Graphs and Interface in Office Environment
Financial Graph Data Overlay on Nighttime Urban Skyline
Digital Data Overlay on Cityscape Depicting Global Economic Trends
Digitally Generated Financial Graphs Overlaid on Cityscape
Global Data Networks and Financial Market Analysis Concept
Abstract Data Deletion Progress in Digital Interface
Diverse Team Analyzing Global Stock Market Trends in Modern Office
Financial Data and Global Business People in Office Reflecting Virtual Analytics
Premium
Hand pointing at a world map with stock market charts and data overlays indicating global financial activity
Digital Agriculture: Pivot Irrigation and Financial Data Integration
Global Financial Analytics with World Map and Stock Trends
Sports Enthusiast Running with Financial Tickers Overlay
Abstract Financial Stock Market Data with City Overlay
Digital Financial Graphics Overlay on Rocky Coastline
Futuristic Financial Trading Hub with Streaming Data
Digital Financial Data on Urban Background
Data Processing with Dynamic Bar Reports on Digital Interface
Modern Financial Analytics in Urban Atmosphere
Premium
Fintech 3d data visualization of a glowing world map highlighting global financial connections in green on a dark grid background
Premium
stock market visual metaphor concept. A crystal ball displaying financial graph trends on a dark cushion.
Premium
Upward trending financial charts and graphs data analytics
Green Energy Digital Finance Overlay with Financial Data and Solar Panels
Global Finance Data with Stock Tickers and World Map Interface
Global Stock Market Data and Digital Economy Graphs
Digital Flash Sale on Cityscape Background
Busy City Street Scene with Futuristic Data and Graph Overlay
Modern Financial Charts with Data Overlay and Highlights
Financial Data Visualization with Digital Display
Futuristic Digital Interface with Globe and Numerical Codes
Premium
Abstract teal background with digital graph lines showcasing upward trends and fluctuations in data, representing financial growth and analytics in business
Stock Market Analysis Showing Data Overlay on Sunset Horizon
Digital Charts Overlay on Misty City Skyline
Stock Market Analytics on Urban Skyline Background
Futuristic City Skyline with Financial Data Overlay
Premium
Abstract representation of financial growth with glowing graphs and data patterns in dark background
Premium
Magnifying glass focusing on financial chart with coins, symbolizing investment analysis and market trends, evoking curiosity and insight
Digital Finance Dashboard Over Modern Urban Landscape
Dynamic Financial Data Overlay Reflected on Urban Architecture
Financial Market Analysis with Graphs and Data Blue Technology
Digital Finance Charts Against Urban Skyline
Premium
Abstract glowing data visualization chart with vibrant colors and cosmic background.
Financial Data and Global Business Interface Overlay on Cityscape
Nurse Examining Patient with Digital Charts Overlay
Digital Interface with Market Metrics and Numeric Visualization
Abstract Financial Trading Data Visualization with Graphs and Charts
Premium
A professional analyzing data trends with hands raised, showcasing vibrant graphs and charts indicating growth and analytics.
Dynamic Finance Double Exposure with Graphs and Data Interfaces
Dynamic Financial Display with Real-Time Stock Data and Graphs
Stock Market Graph Over Cityscape with Building Reflections
Futuristic Financial Data with Dynamic Rising Graphs
Scottish Flag With Financial Markets Line Chart Overlay
Digital Data Visualization Impact on Business Discussions
3D Pie Chart Over Financial Dashboard with Scrolling Tickers
Global Business Trends with Stock Market Data Overlay
Futuristic City Financial Stocks Data Overlay
Premium
Professional analyst reviews dynamic financial data visualizations on a modern laptop, driving business growth and informed decisions.
Premium
3D blue bar chart showing financial data growth and success
Premium
The vibrant growth chart showcasing dynamic financial trends in a modern office environment.
Financial Data Overlay with Cityscape Background Visualizing Economic Trends
Stock Market Data Analysis Digital Chart Green Background
Financial Data Overlay on Wind Turbines Illustrating Energy Business Insights
Premium
Futuristic glowing blue digital dashboard with interactive charts graphs and analytics showing upward growth trend for business financial and technology data visualization concepts
Premium
Human hand holding a glowing abstract digital globe with financial data visualization and connectivity
Stock Market Trading Concept with Reflective Data
Nature and Data Integration with Forest and Financial Graphics
Zimbabwean Flag Overlay with Financial Charts and Data Visualizations
Global Financial Markets Concept with Graphs and Globe
Premium
Business growth analysis concept. Person interacting with bar graph forecasting data trends from 2022 to 2026, representing financial planning and market strategy, profit increases, investments,
Ukrainian Flag Overlay on Financial Data Symbols Increasing Volatility
Financial Data Overlaying Industrial Apron Scene
Futuristic Data Visualization with Digital Code Overlay
Digital Data Streams Over Modern City Skyline
Business Professionals Analyzing Stock Market Data in Office Environment
Premium
A magnifying glass focuses on a fluctuating line graph, symbolizing analysis and scrutiny in data trends and financial metrics.
Abstract Patterns of Stock Market Financial Data Graphs
Financial Data Overlay on Retail Store Environment
Futuristic Financial Data Analysis Over Cityscape
Airplane Silhouette Against Data Screen with Graphs
Sunset Through Financial Charts Symbolizing Market Dynamics
Financial Data Insights Over Modern Cityscape Concept
Stock Market Analytics Through Urban Office Reflections
Financial Data Overlay on City Skyline with Candlestick Patterns
Data Processing with Stock Market Analysis Theme
Digital Financial Dataset Overlaying Nighttime Urban Intersection
Innovative Technology Stocks with Risk Icon
Premium
Investment growth analytics financial sector infographic urban environment macro view economic insights
Financial Data Interface Overlaying Urban Cityscape
Digital Stock Market Trading Display with Graphs and Data
Businesswoman Analyzing Digital Financial Data Overlaid with World Map
Digital Interface Displaying Real-Time Financial Data
Premium
AI finance business data analysis digital technology investment trading market stock, financial analyst using advanced holographic interface for global market insight, smart investment strategy
Croatian Flag Overlapping Stock Market Display with Financial Data
Financial Statistics Overlaid on Highway Traffic at Dusk
Global Finance and Economic Trends Overlaying Cityscape
Social Media Engagement Interface with Data Analytics Dashboard
Premium
Dynamic digital network visualization showcasing data flow between interconnected nodes and currency symbols, representing secure financial transactions and global connectivity.
Stock Market Trend Charts Over Urban Skyline
Financial Data Overlay on Modern Office Building Represents Global Business Analysis
Dynamic Numeric Data and Code Floating in Futuristic Space
Sustainable Energy and Data Analytics Integration
Premium
A financial and marketing KPI dashboard for business analytics and strategy. A report showing profit, revenue, and customer conversion rate data. Motif
Financial Analytics Dashboard with User Engagement Alerts
Digital Numbers Displaying Stock Market Data and Analysis
Cybersecurity in Financial Analytics with Digital Data Interface
Premium
A digital stock market chart illustrating global business growth, financial success, investment strategy, and economic data.
Futuristic Digital Globe Overlaid with Financial Statistics
Explore More Free Stock Images