
- Home >
- Free Stock Photos & Images >
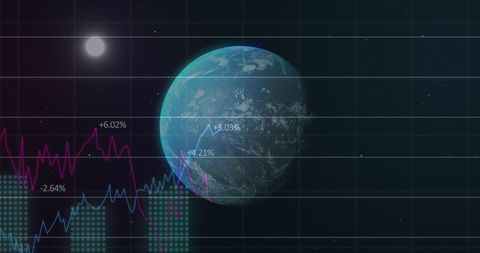
- Translucent Globe Overlapping Analytics Dashboard Displaying Global Data Trends Heatmap
Translucent Globe Overlapping Analytics Dashboard Displaying Global Data Trends Heatmap Free Stock Image

Displaying translucent globe overlaid on grid dashboard with numeric labels, candlestick charts, bar graphs, heatmap points, and trend lines. Combining global map and digital analytics elements for futuristic tech look. Featuring cool green-blue color palette and translucent data layers for depth and motion. Serving as background for slides, website hero sections, landing pages, social media banners, and editorial layouts focused on global data, financial markets, or network monitoring. Supporting use in presentations for fintech, data science, business intelligence, cybersecurity operations, and market analysis reports. Customizable color and opacity for branding, print, or digital media.
Powered by  - Get 15% off with code: PIKWIZARD15


downloads
Tags:
More
Credit Photo
If you would like to credit the Photo, here are some ways you can do so
Text Link
photo Link
<span class="text-link">
<span>
<a target="_blank" href=https://pikwizard.com/photo/translucent-globe-overlapping-analytics-dashboard-displaying-global-data-trends-heatmap/e9413d4e097d83c65db4ca86fdb86409/>PikWizard</a>
</span>
</span>
<span class="image-link">
<span
style="margin: 0 0 20px 0; display: inline-block; vertical-align: middle; width: 100%;"
>
<a
target="_blank"
href="https://pikwizard.com/photo/translucent-globe-overlapping-analytics-dashboard-displaying-global-data-trends-heatmap/e9413d4e097d83c65db4ca86fdb86409/"
style="text-decoration: none; font-size: 10px; margin: 0;"
>
<img src="https://thumbs.wbm.im/pw/medium/e9413d4e097d83c65db4ca86fdb86409.jpg" style="margin: 0; width: 100%;" alt="Translucent Globe Overlapping Analytics Dashboard Displaying Global Data Trends Heatmap" />
<p style="font-size: 12px; margin: 0;">PikWizard</p>
</a>
</span>
</span>
Free (free of charge)
Free for personal and commercial use.
Author: Creative Art
Similar Free Stock Images


Premium


Premium


Premium


Premium


Premium


Premium


Premium


Premium


Premium


Premium


Premium


Premium


Premium


Premium


Premium


Premium


Premium


Premium


Premium


Premium


Premium


Premium


Premium


Premium


Premium

Explore More Free Stock Images