- Home >
- Stock Photos >
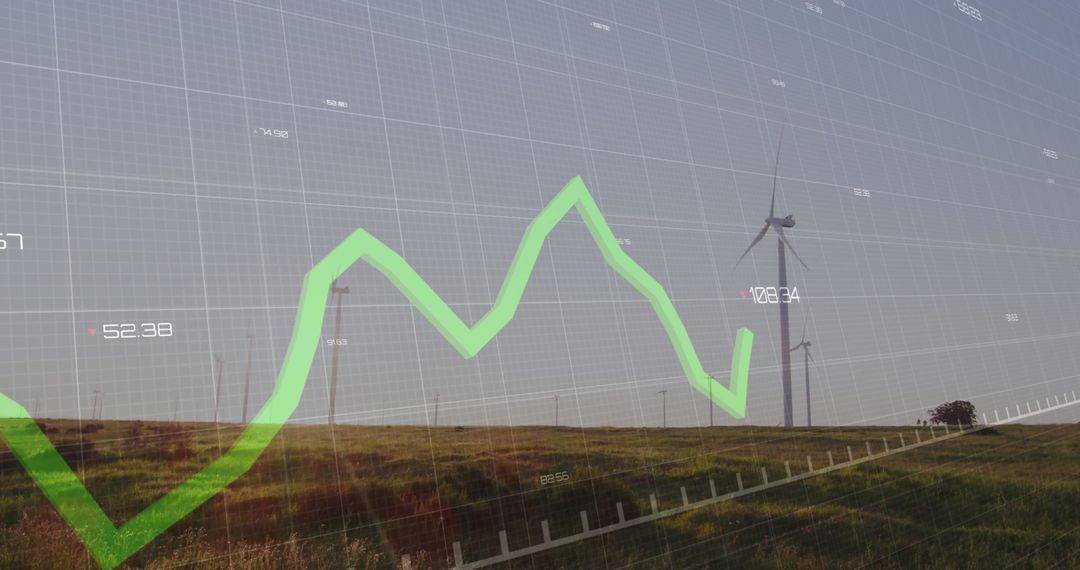
- Translucent Graphs over Peaceful Field at Sunset
Translucent Graphs over Peaceful Field at Sunset Image
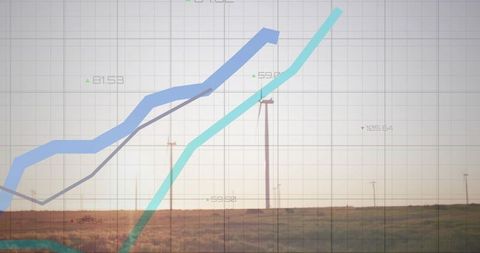
Visual representing data growth over serene field at sunset, ideal for conveying themes of financial progress and analytics savvy. Useful for presentations regarding data analysis or technological advancements.
Powered by 


0
downloads
downloads
Tags:
More
Credit Photo
If you would like to credit the Photo, here are some ways you can do so
Text Link
photo Link
<span class="text-link">
<span>
<a target="_blank" href=https://pikwizard.com/photo/translucent-graphs-over-peaceful-field-at-sunset/8312f8132c6b8baf7b96c36fab563062/>PikWizard</a>
</span>
</span>
<span class="image-link">
<span
style="margin: 0 0 20px 0; display: inline-block; vertical-align: middle; width: 100%;"
>
<a
target="_blank"
href="https://pikwizard.com/photo/translucent-graphs-over-peaceful-field-at-sunset/8312f8132c6b8baf7b96c36fab563062/"
style="text-decoration: none; font-size: 10px; margin: 0;"
>
<img src="https://pikwizard.com/pw/medium/8312f8132c6b8baf7b96c36fab563062.jpg" style="margin: 0; width: 100%;" alt="" />
<p style="font-size: 12px; margin: 0;">PikWizard</p>
</a>
</span>
</span>
Free (free of charge)
Free for personal and commercial use.
Author: Authentic Images
Similar Free Stock Images

Premium


Premium


Premium


Premium


Premium


Premium


Premium


Premium


Premium


Premium


Premium


Premium


Premium


Premium


Premium


Premium


Premium


Premium


Premium


Premium


Premium


Premium


Premium


Premium