- Home >
- Stock Photos >
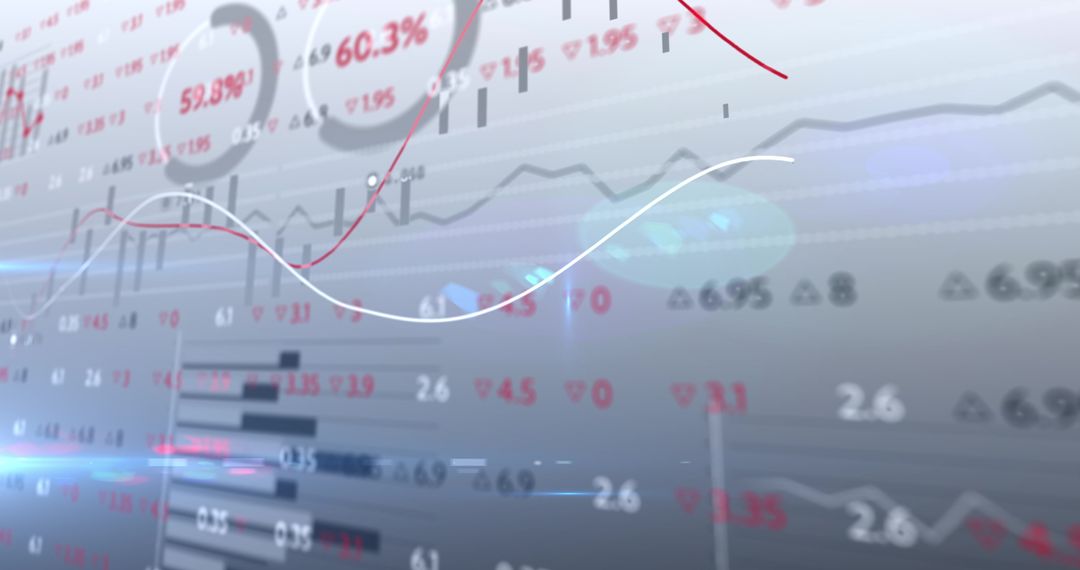
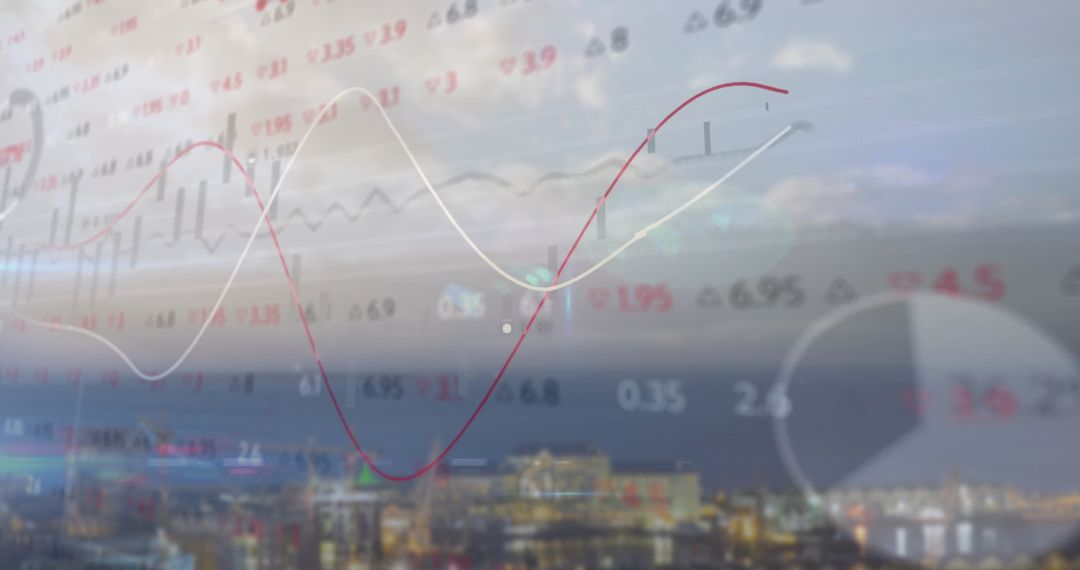
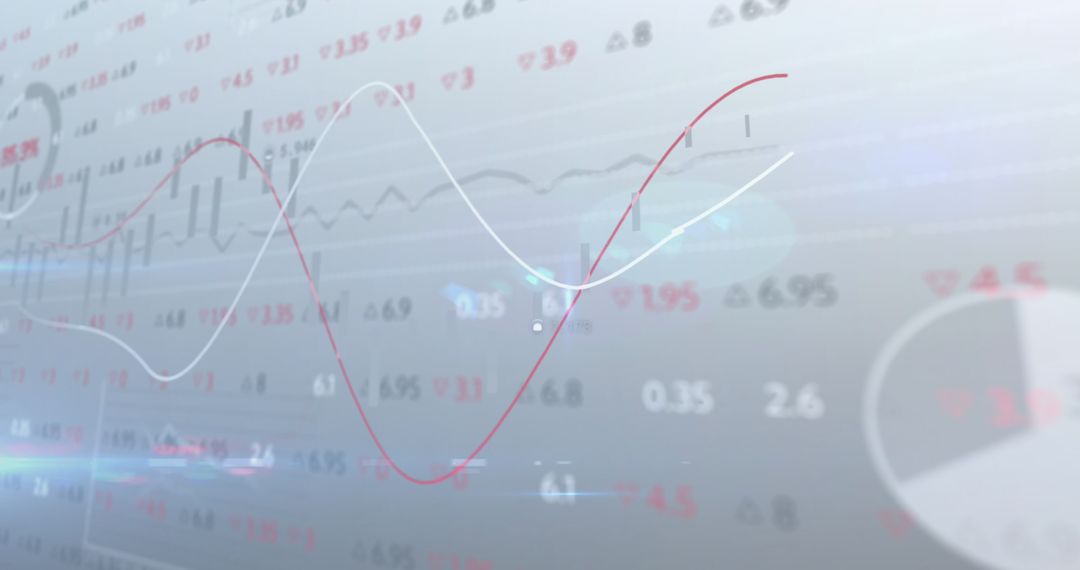
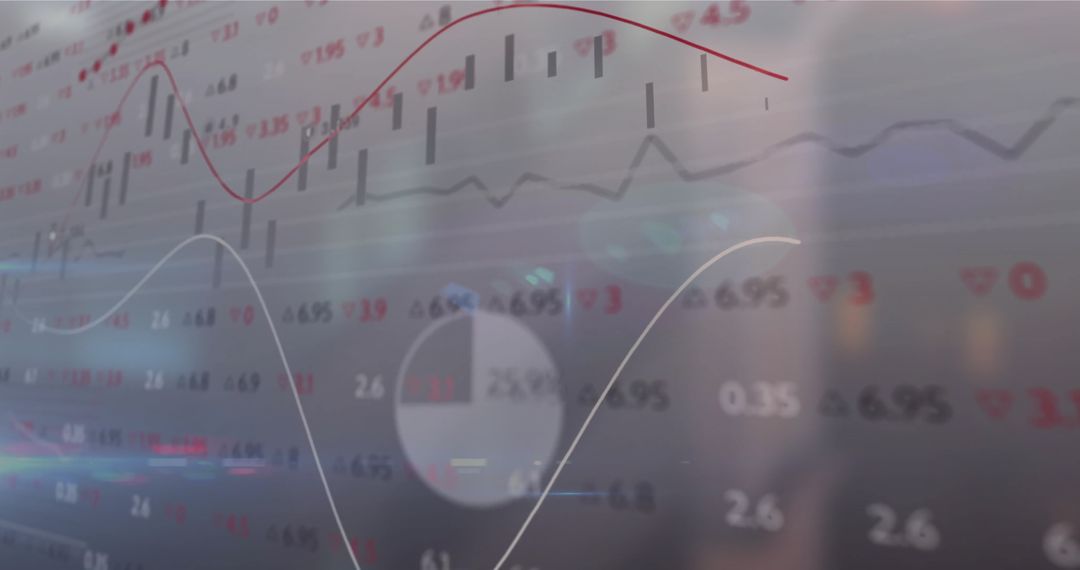
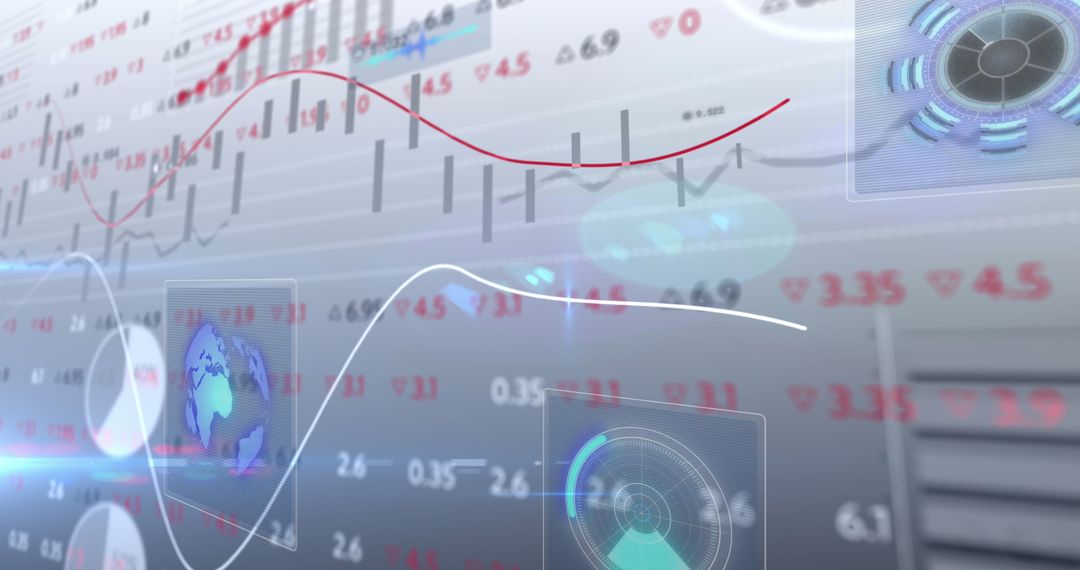
- Translucent Market Data Overlay Featuring Candlestick Charts and Trend Lines on Dashboard
Translucent Market Data Overlay Featuring Candlestick Charts and Trend Lines on Dashboard Image

Translucent multi-layer market data visualization showing candlestick bars, vertical volume bars, curved trend lines and blurred numeric overlays over grid background. Cool gray-blue palette with subtle lens flare conveying motion and high-tech atmosphere. Suiting financial and fintech projects requiring modern data-driven look. Working well for website hero banners, trading platform dashboards, investor presentation slides, market analysis reports, social media finance posts, blog headers, video overlays, and app mockups. Allowing space for adding ticker symbols, company logos, or call-to-action. Delivering versatile background for editorial content, marketing materials, pitch decks, and training modules about market trends and trading strategies.
Powered by  - Get 15% off with code: PIKWIZARD15


0
downloads
downloads
Tags:
More
Credit Photo
If you would like to credit the Photo, here are some ways you can do so
Text Link
photo Link
<span class="text-link">
<span>
<a target="_blank" href=https://pikwizard.com/photo/translucent-market-data-overlay-featuring-candlestick-charts-and-trend-lines-on-dashboard/989a6a58fd9d8ec9e07aa8b3230692a0/>PikWizard</a>
</span>
</span>
<span class="image-link">
<span
style="margin: 0 0 20px 0; display: inline-block; vertical-align: middle; width: 100%;"
>
<a
target="_blank"
href="https://pikwizard.com/photo/translucent-market-data-overlay-featuring-candlestick-charts-and-trend-lines-on-dashboard/989a6a58fd9d8ec9e07aa8b3230692a0/"
style="text-decoration: none; font-size: 10px; margin: 0;"
>
<img src="https://pikwizard.com/pw/medium/989a6a58fd9d8ec9e07aa8b3230692a0.jpg" style="margin: 0; width: 100%;" alt="" />
<p style="font-size: 12px; margin: 0;">PikWizard</p>
</a>
</span>
</span>
Free (free of charge)
Free for personal and commercial use.
Author: People Creations
Similar Free Stock Images
Premium


Premium


Premium


Premium


Premium


Premium


Premium


Premium


Premium


Premium


Premium


Premium


Premium


Premium


Premium


Premium


Premium


Premium


Premium


Premium


Premium


Premium


Premium


Premium