
- Home >
- Stock Photos >
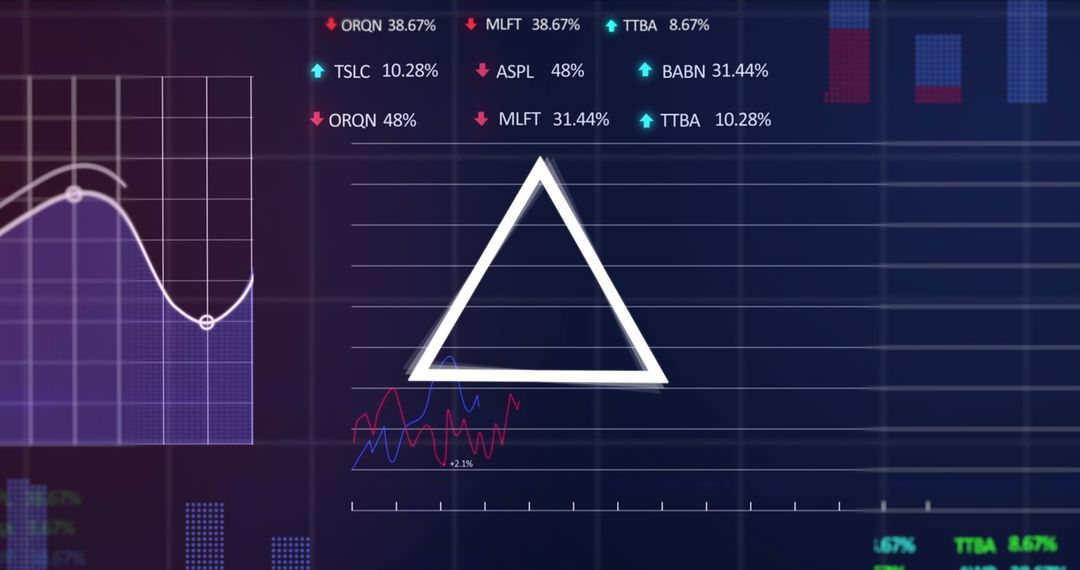
- Translucent Upward Arrow Crossing Blue Bar Chart Showing Financial Growth and Data Trends
Translucent Upward Arrow Crossing Blue Bar Chart Showing Financial Growth and Data Trends Image

Featuring translucent upward arrow crossing layered blue bar chart and smooth line graph, complemented by grid and compact ticker readouts. Offering modern neon blue palette and digital overlays, conveying data-driven growth, market momentum, and analytical insight. Serving as dynamic visual for finance presentations, investor pitch decks, annual reports, marketing campaigns, SaaS dashboards, and website hero banners highlighting revenue growth or KPI progress. Working well as header graphic, background for charts, or thumbnail for articles about investing, stock market, business strategy, and economic trends. Customizable for text overlay and branding, supporting high-contrast headlines and call-to-action elements.
Powered by  - Get 15% off with code: PIKWIZARD15


0
downloads
downloads
Tags:
More
Credit Photo
If you would like to credit the Photo, here are some ways you can do so
Text Link
photo Link
<span class="text-link">
<span>
<a target="_blank" href=https://pikwizard.com/photo/translucent-upward-arrow-crossing-blue-bar-chart-showing-financial-growth-and-data-trends/205bcaa3ac2062e7a9fea43b70d63f83/>PikWizard</a>
</span>
</span>
<span class="image-link">
<span
style="margin: 0 0 20px 0; display: inline-block; vertical-align: middle; width: 100%;"
>
<a
target="_blank"
href="https://pikwizard.com/photo/translucent-upward-arrow-crossing-blue-bar-chart-showing-financial-growth-and-data-trends/205bcaa3ac2062e7a9fea43b70d63f83/"
style="text-decoration: none; font-size: 10px; margin: 0;"
>
<img src="https://pikwizard.com/pw/medium/205bcaa3ac2062e7a9fea43b70d63f83.jpg" style="margin: 0; width: 100%;" alt="" />
<p style="font-size: 12px; margin: 0;">PikWizard</p>
</a>
</span>
</span>
Free (free of charge)
Free for personal and commercial use.
Author: Authentic Images
Similar Free Stock Images

Premium


Premium


Premium


Premium


Premium


Premium


Premium


Premium


Premium


Premium


Premium


Premium


Premium


Premium


Premium


Premium


Premium


Premium


Premium


Premium


Premium


Premium


Premium


Premium
