
- Home >
- Stock Photos >
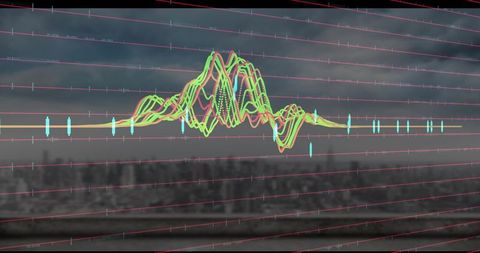
- Translucent Waveforms Flowing Across Hollow Cube Grid for Minimal Data Visualization
Translucent Waveforms Flowing Across Hollow Cube Grid for Minimal Data Visualization Image

Composition featuring translucent waveforms flowing across hollow cube grid, dotted white line adding rhythm and movement. Palette combining soft gray, cyan, and white, creating clean futuristic mood. Ideal for hero banners, website headers, app backgrounds, presentation slides, data dashboards, marketing materials, technology reports, editorial spreads. Working well for branding, UI mockups, corporate presentations, startup pitch decks, social media headers, music album covers, desktop wallpapers. Cropping-friendly for horizontal and square layouts. Layering and blending options working well for motion graphics and animated transitions. High-resolution detail supporting print and digital use.
Powered by  - Get 15% off with code: PIKWIZARD15


downloads
Tags:
More
Credit Photo
If you would like to credit the Photo, here are some ways you can do so
Text Link
photo Link
<span class="text-link">
<span>
<a target="_blank" href=https://pikwizard.com/photo/translucent-waveforms-flowing-across-hollow-cube-grid-for-minimal-data-visualization/436865d9c5fb1901dac1db1ae94d935e/>PikWizard</a>
</span>
</span>
<span class="image-link">
<span
style="margin: 0 0 20px 0; display: inline-block; vertical-align: middle; width: 100%;"
>
<a
target="_blank"
href="https://pikwizard.com/photo/translucent-waveforms-flowing-across-hollow-cube-grid-for-minimal-data-visualization/436865d9c5fb1901dac1db1ae94d935e/"
style="text-decoration: none; font-size: 10px; margin: 0;"
>
<img src="https://pikwizard.com/pw/medium/436865d9c5fb1901dac1db1ae94d935e.jpg" style="margin: 0; width: 100%;" alt="" />
<p style="font-size: 12px; margin: 0;">PikWizard</p>
</a>
</span>
</span>
Free (free of charge)
Free for personal and commercial use.
Author: Creative Art
Similar Free Stock Images

Premium


Premium

Premium


Premium


Premium


Premium


Premium


Premium

Premium

Premium

Premium


Premium

Premium


Premium


Premium


Premium


Premium


Premium


Premium

Premium


Premium


Premium


Premium
Premium


Premium


Explore More Free Stock Images