- Home >
- Stock Photos >
- Transparent Dashboard Overlay Displaying Analytics Charts, Graphs, Performance Metrics
Transparent Dashboard Overlay Displaying Analytics Charts, Graphs, Performance Metrics Image
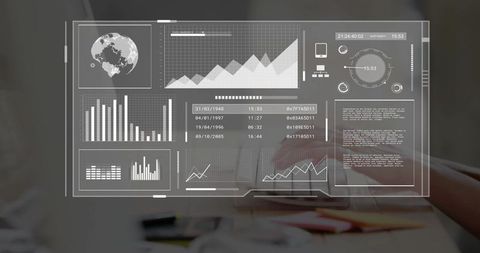
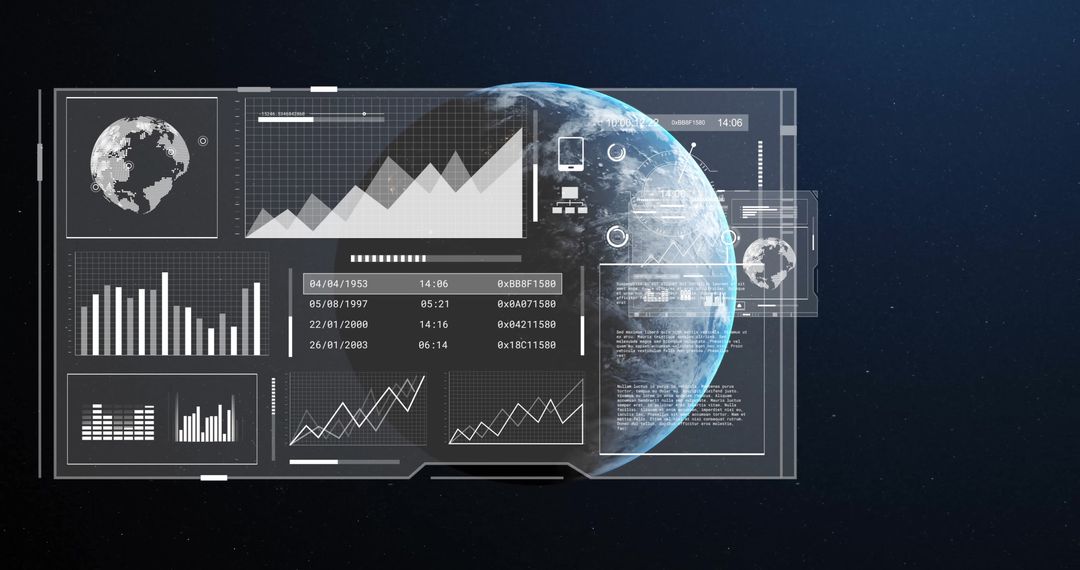
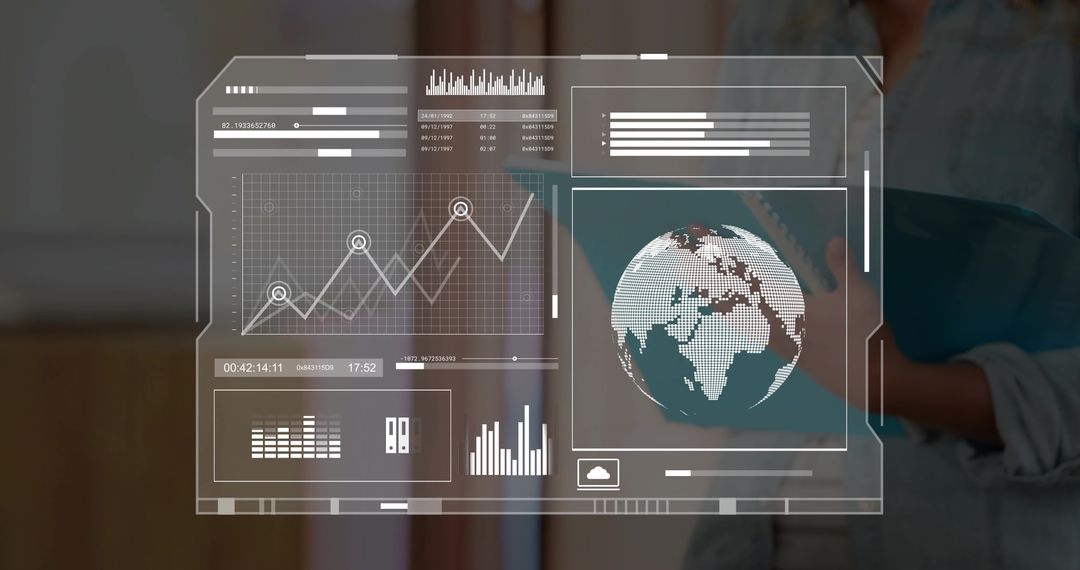
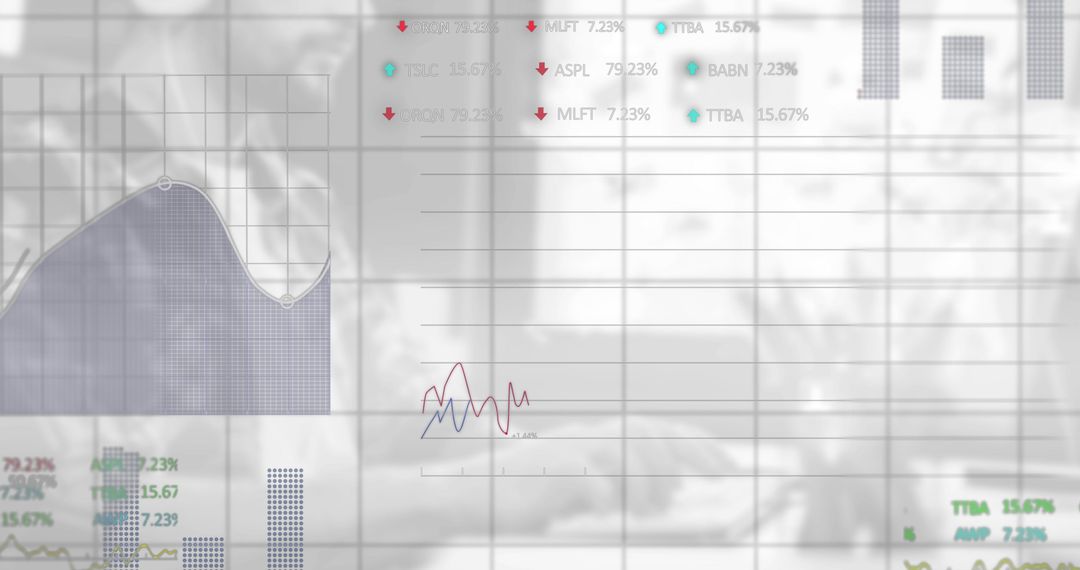
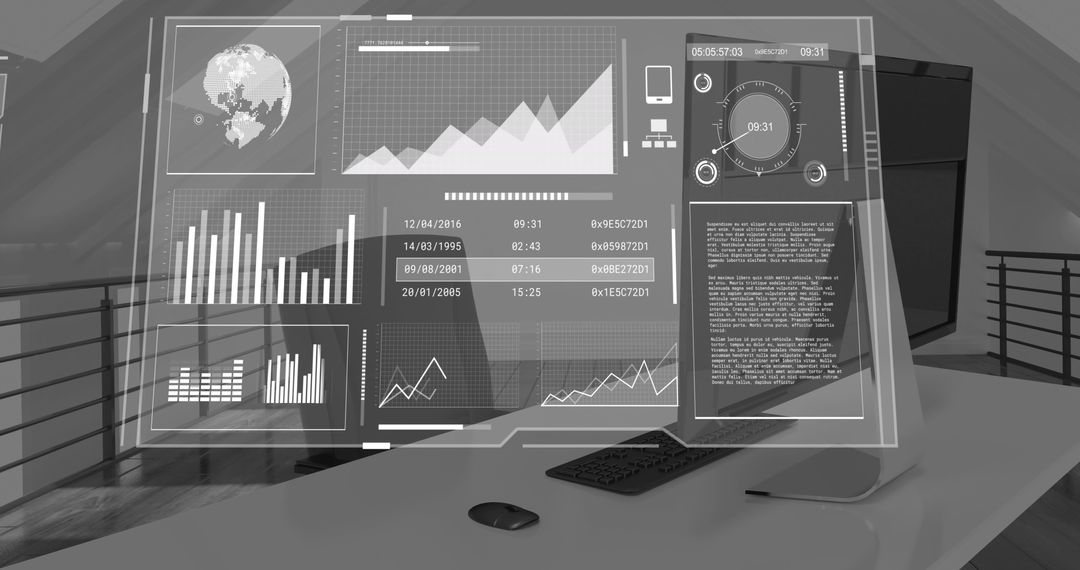
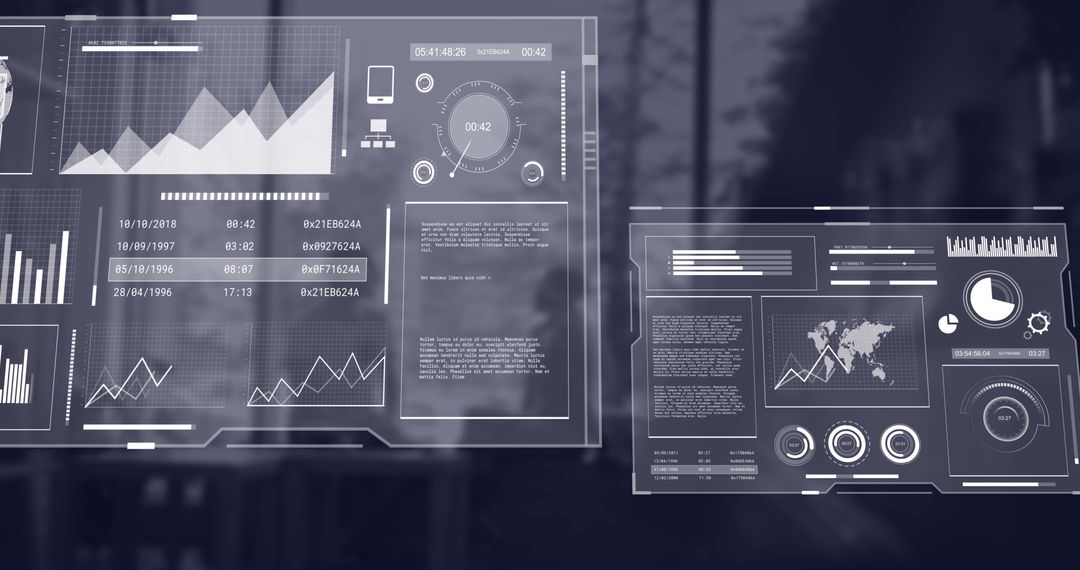
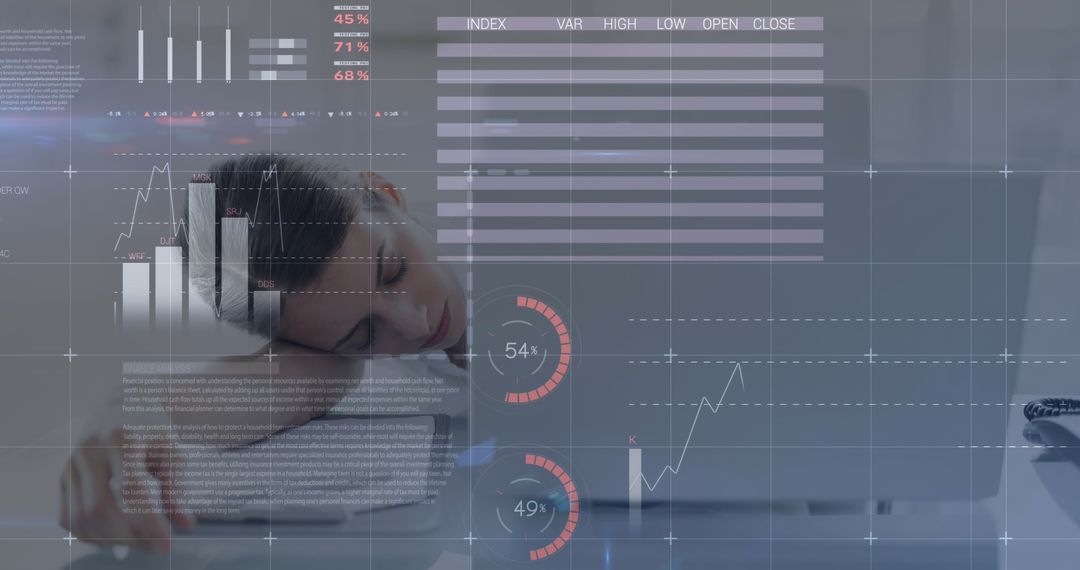
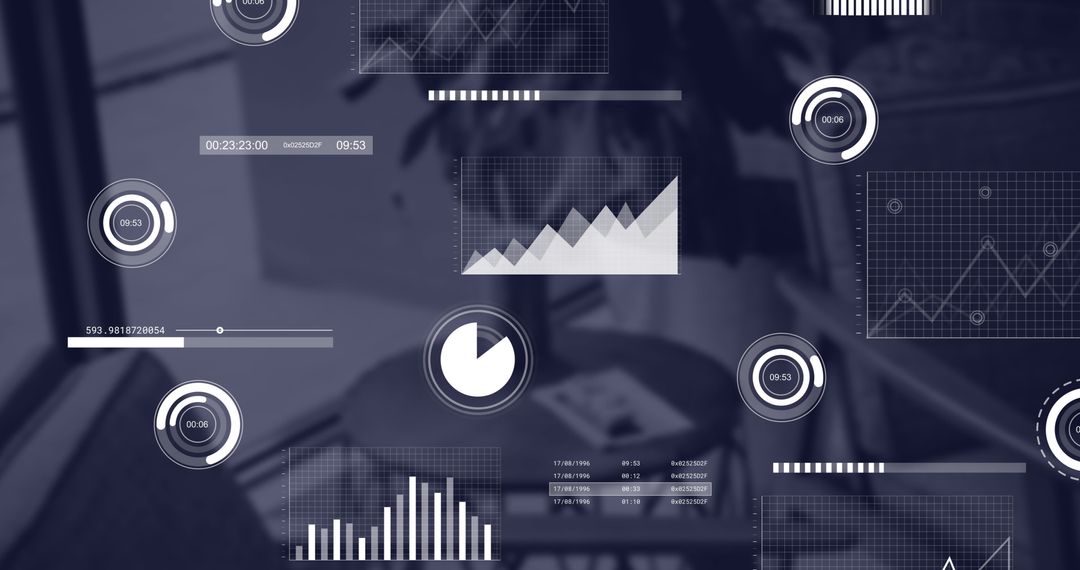
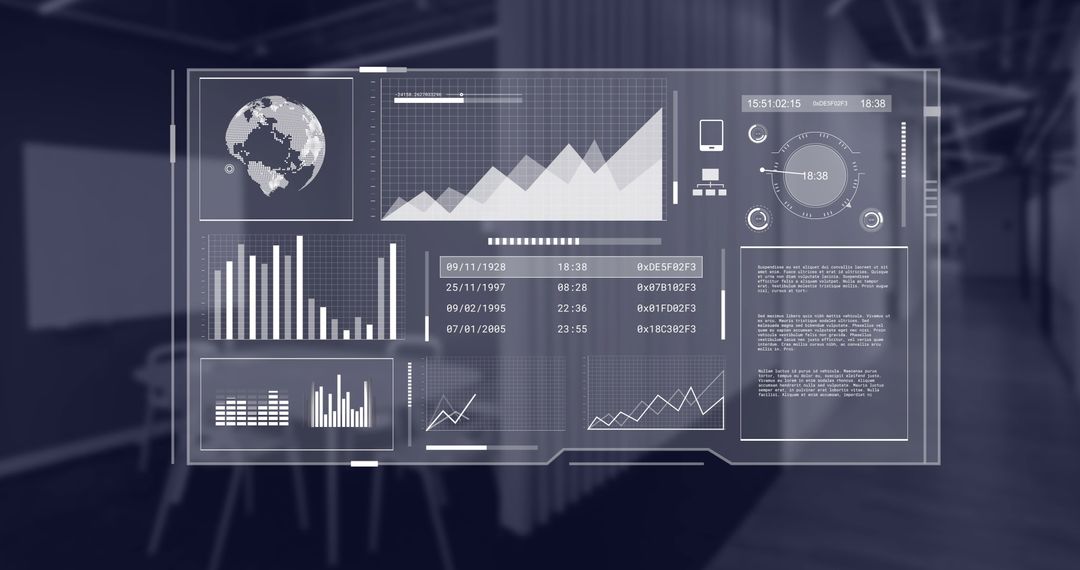
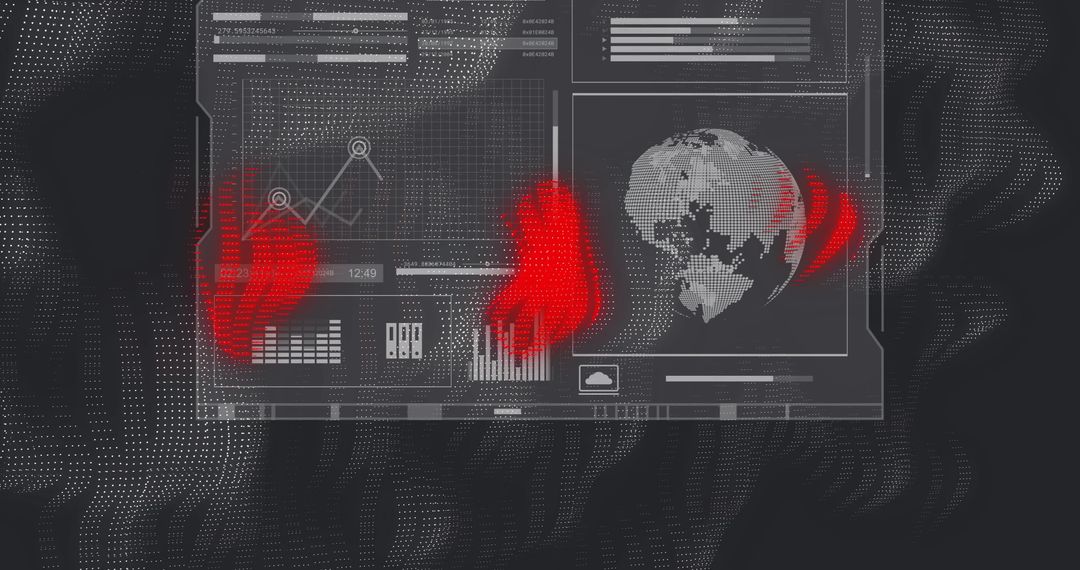
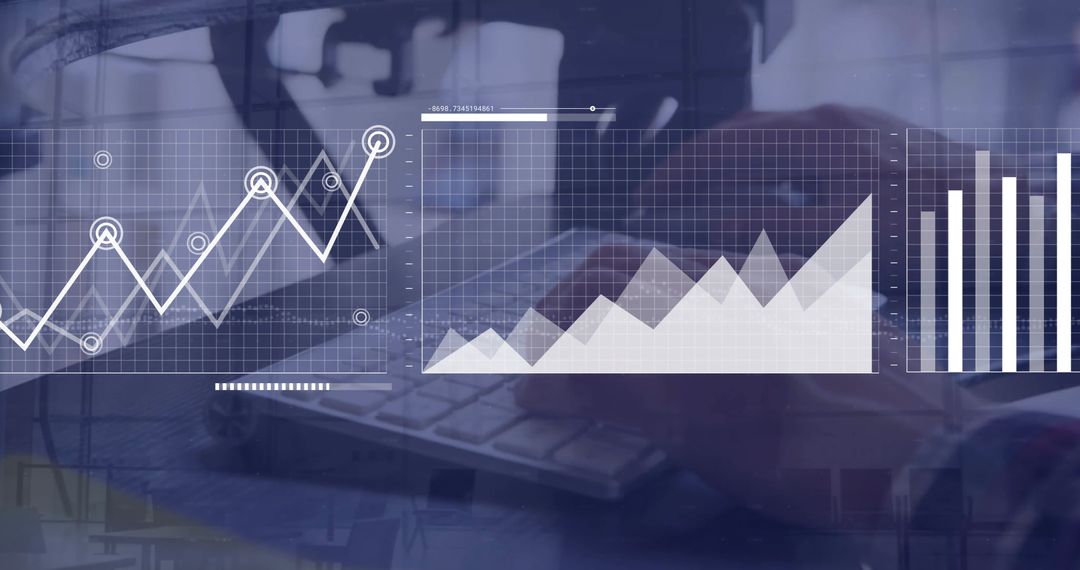
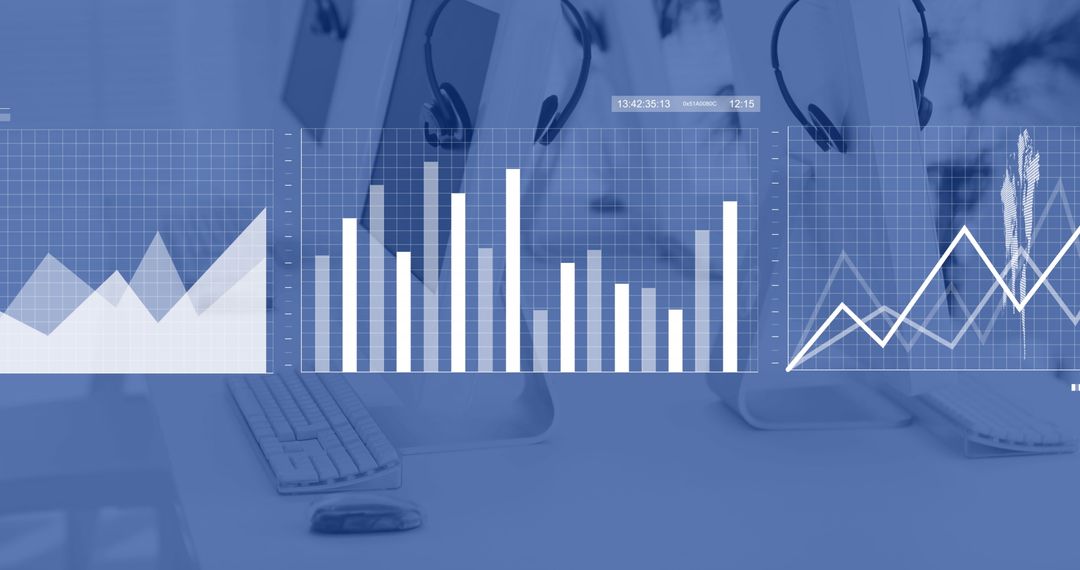
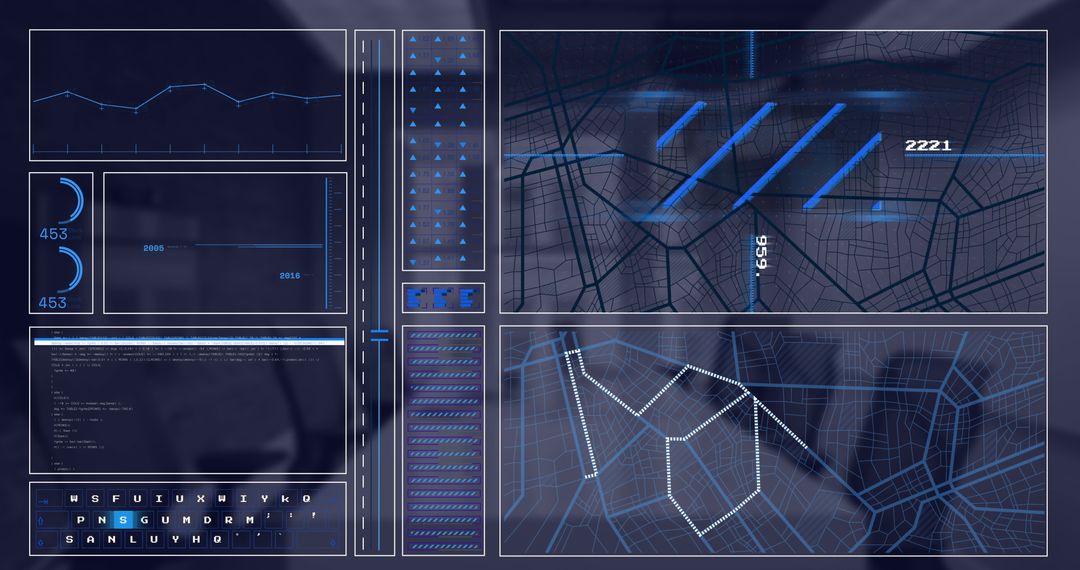
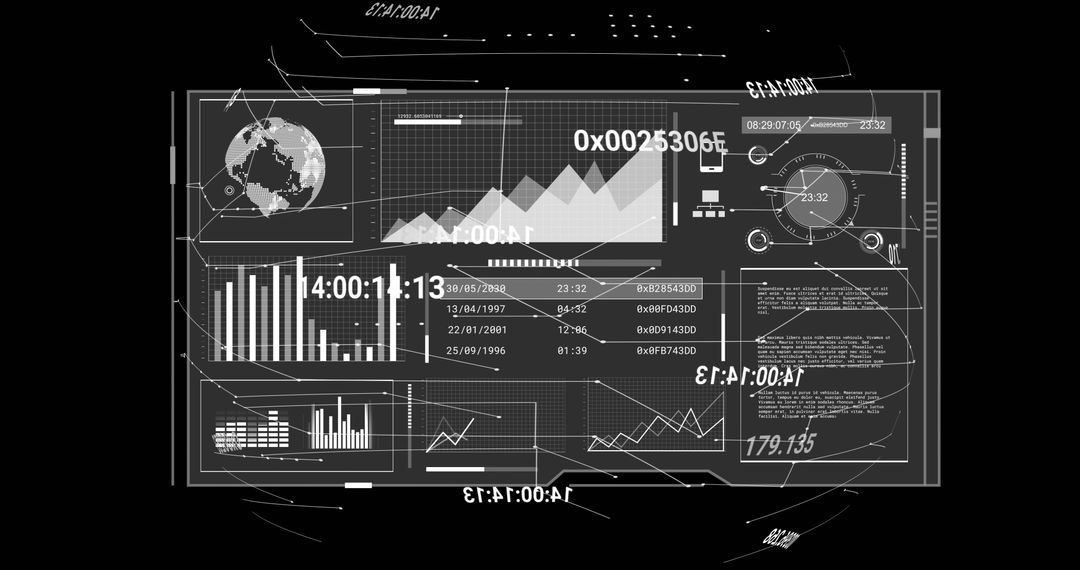
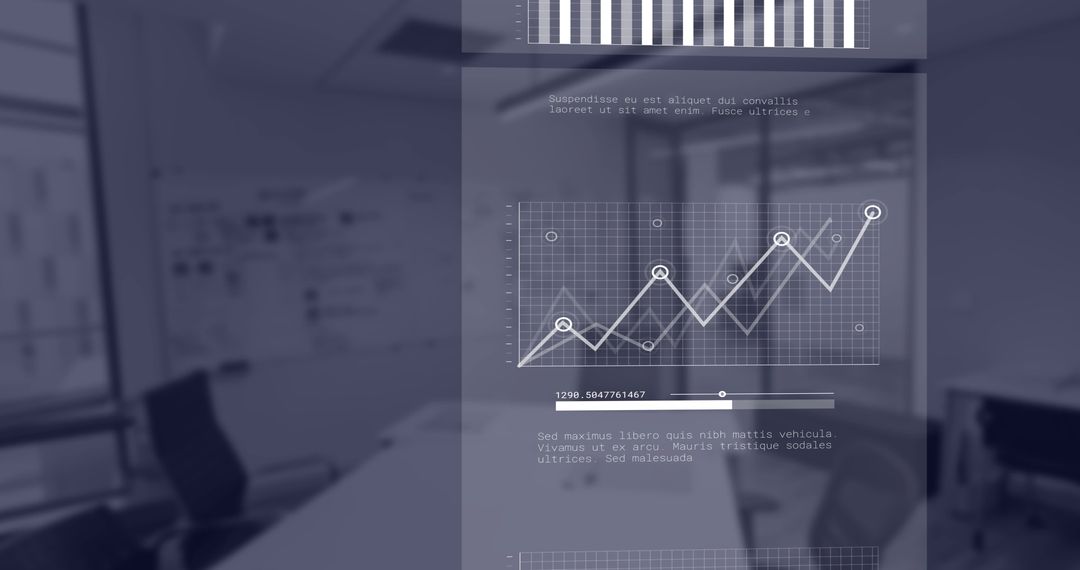
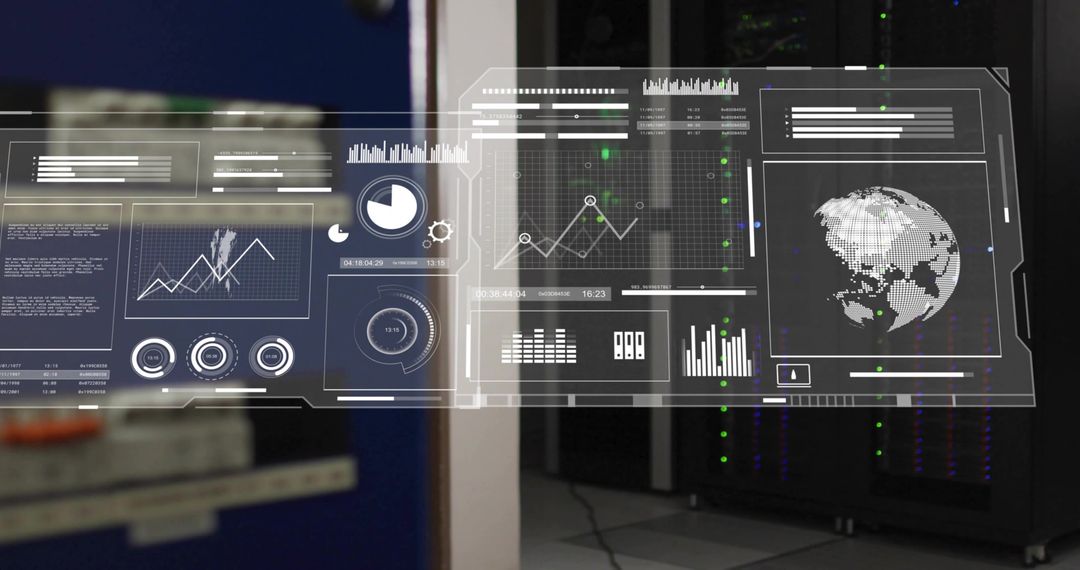
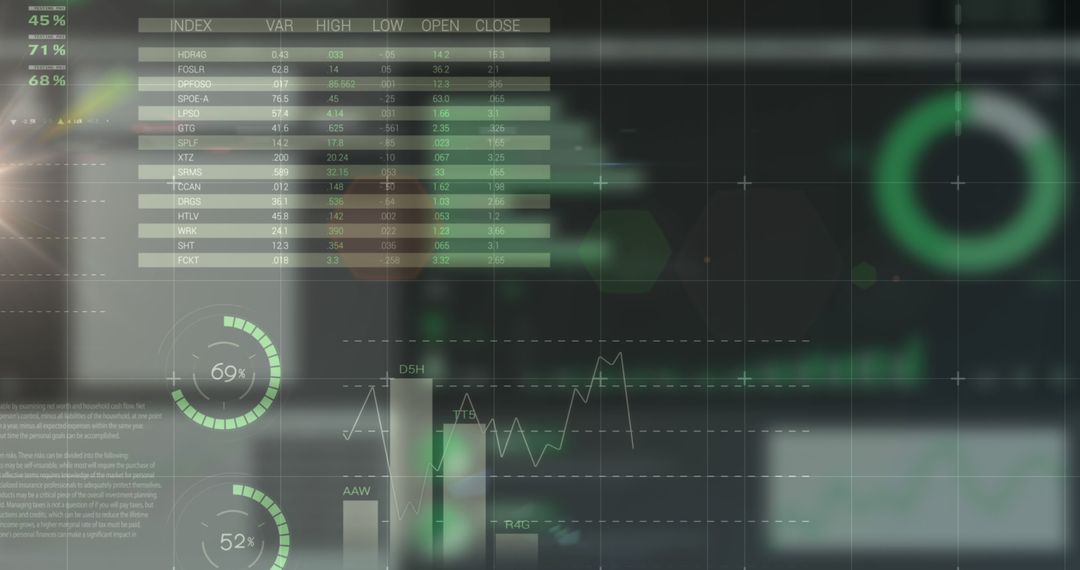
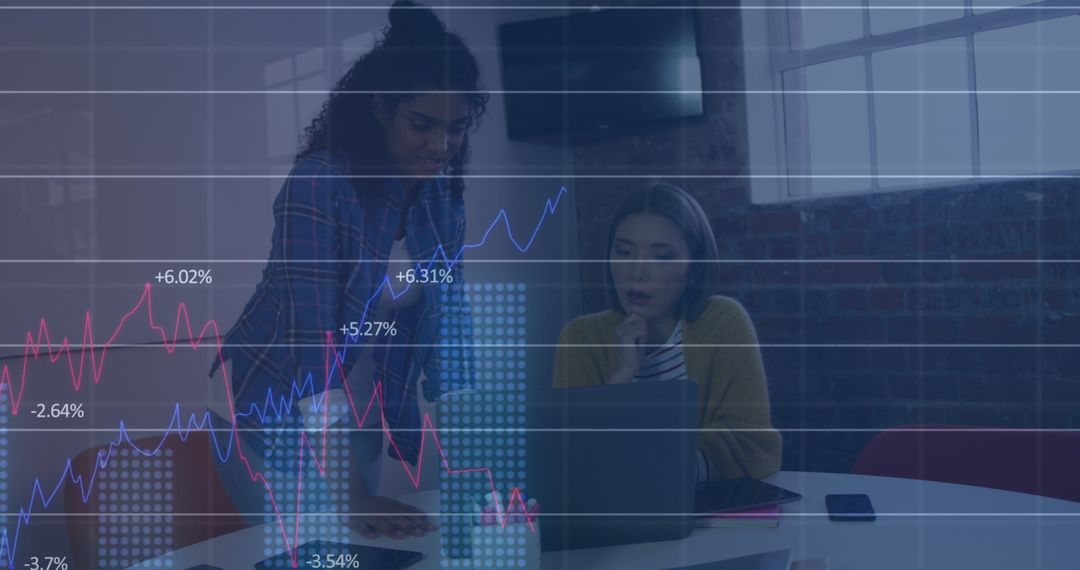
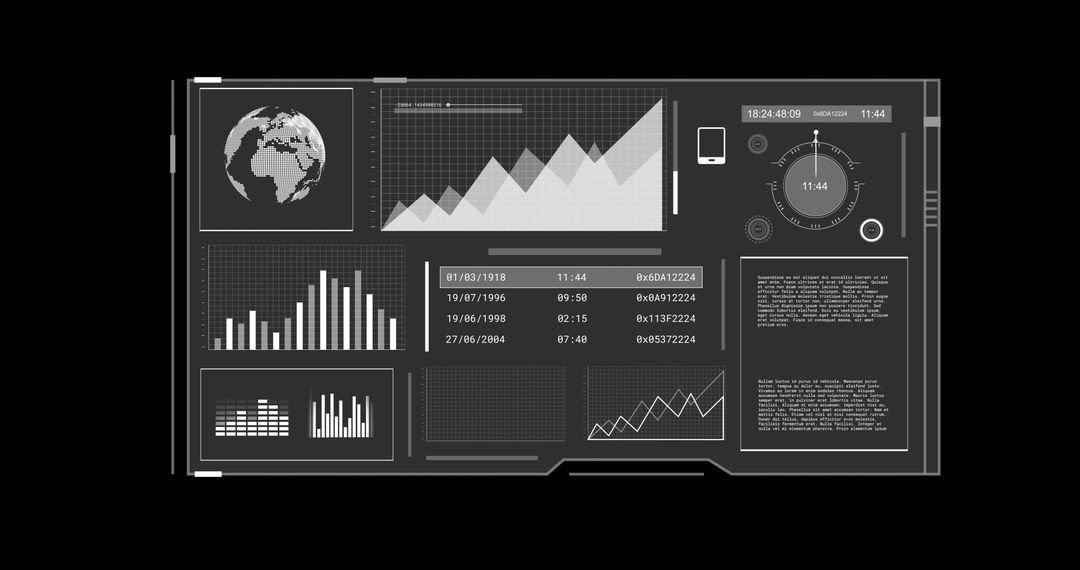
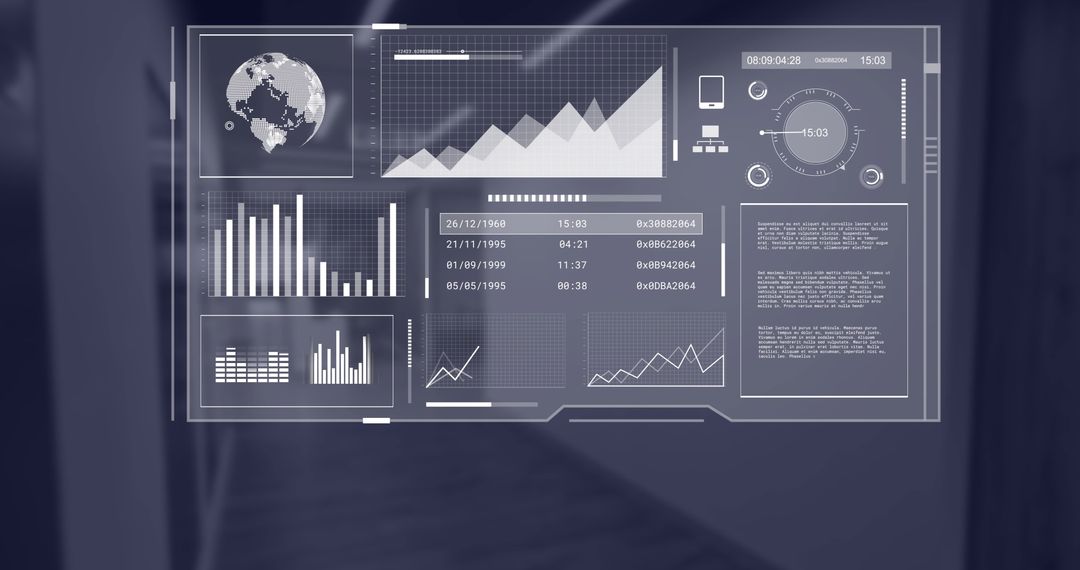
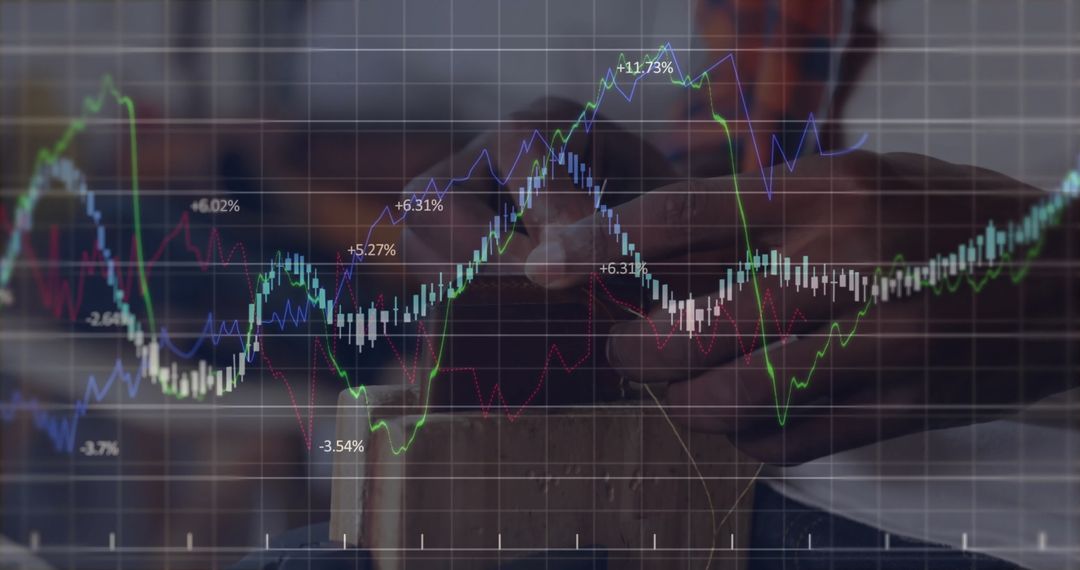
Translucent dashboard overlay presenting grayscale analytics panels over workspace with hands typing on laptop. Layout including world map, area chart, bar charts, line graphs, numeric timestamps, circular gauge and text panels for reports. Serving well for business presentations, website hero sections, product landing pages, app interface mockups, investor pitch decks, analytics reports, training materials, blog headers and social media posts. Supporting illustration of data-driven decision making, demonstrating dashboard features, explaining KPI tracking, promoting BI software and showcasing fintech or cybersecurity platforms. Layering over blurred workspace creating professional tech look for marketing materials, investor communications and internal reports. Ready for cropping into headers, hero banners, slide decks and UI concept visuals.
Powered by 


0
downloads
downloads
Tags:
More
Credit Photo
If you would like to credit the Photo, here are some ways you can do so
Text Link
photo Link
<span class="text-link">
<span>
<a target="_blank" href=https://pikwizard.com/photo/transparent-dashboard-overlay-displaying-analytics-charts-graphs-performance-metrics/118d2a186ee98f50f8a6704b8ae9c977/>PikWizard</a>
</span>
</span>
<span class="image-link">
<span
style="margin: 0 0 20px 0; display: inline-block; vertical-align: middle; width: 100%;"
>
<a
target="_blank"
href="https://pikwizard.com/photo/transparent-dashboard-overlay-displaying-analytics-charts-graphs-performance-metrics/118d2a186ee98f50f8a6704b8ae9c977/"
style="text-decoration: none; font-size: 10px; margin: 0;"
>
<img src="https://pikwizard.com/pw/medium/118d2a186ee98f50f8a6704b8ae9c977.jpg" style="margin: 0; width: 100%;" alt="" />
<p style="font-size: 12px; margin: 0;">PikWizard</p>
</a>
</span>
</span>
Free (free of charge)
Free for personal and commercial use.
Author: Authentic Images
Similar Free Stock Images

Premium


Premium


Premium


Premium


Premium


Premium


Premium


Premium


Premium


Premium


Premium


Premium


Premium


Premium


Premium


Premium


Premium


Premium


Premium


Premium


Premium


Premium


Premium


Premium