
- Home >
- Stock Photos >
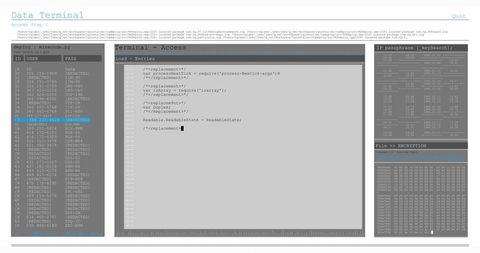
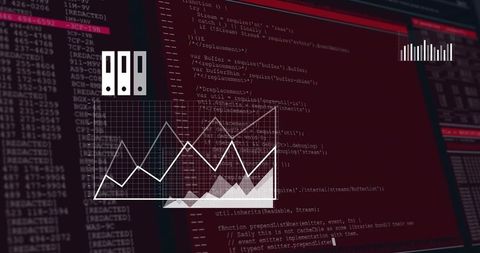
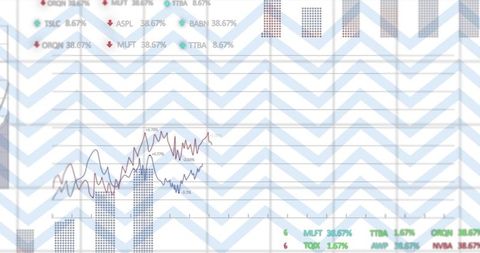
- Transparent Digital Terminal Displaying JavaScript Overlapping Financial Analysis
Transparent Digital Terminal Displaying JavaScript Overlapping Financial Analysis Image
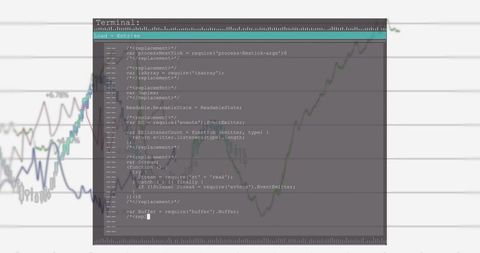
Screen displaying translucent terminal with JavaScript code overlaying a financial chart, symbolizing the intersection of technology and finance. Suggests how coding influences financial analytics and market strategies, ideal for materials on stock market analytics, data visualization software, and tech-related investment strategies.
Powered by 


downloads
Tags:
More
Credit Photo
If you would like to credit the Photo, here are some ways you can do so
Text Link
photo Link
<span class="text-link">
<span>
<a target="_blank" href=https://pikwizard.com/photo/transparent-digital-terminal-displaying-javascript-overlapping-financial-analysis/6c7b6e3dc708145015ae148f92b6dfe8/>PikWizard</a>
</span>
</span>
<span class="image-link">
<span
style="margin: 0 0 20px 0; display: inline-block; vertical-align: middle; width: 100%;"
>
<a
target="_blank"
href="https://pikwizard.com/photo/transparent-digital-terminal-displaying-javascript-overlapping-financial-analysis/6c7b6e3dc708145015ae148f92b6dfe8/"
style="text-decoration: none; font-size: 10px; margin: 0;"
>
<img src="https://pikwizard.com/pw/medium/6c7b6e3dc708145015ae148f92b6dfe8.jpg" style="margin: 0; width: 100%;" alt="" />
<p style="font-size: 12px; margin: 0;">PikWizard</p>
</a>
</span>
</span>
Free (free of charge)
Free for personal and commercial use.
Author: People Creations
Similar Free Stock Images

Premium


Premium


Premium


Premium


Premium


Premium


Premium


Premium


Premium

Premium


Premium

Premium


Premium


Premium


Premium


Premium

Premium


Premium


Premium


Premium


Premium


Premium

Premium


Premium


Premium


Explore More Free Stock Images