- Home >
- Stock Photos >
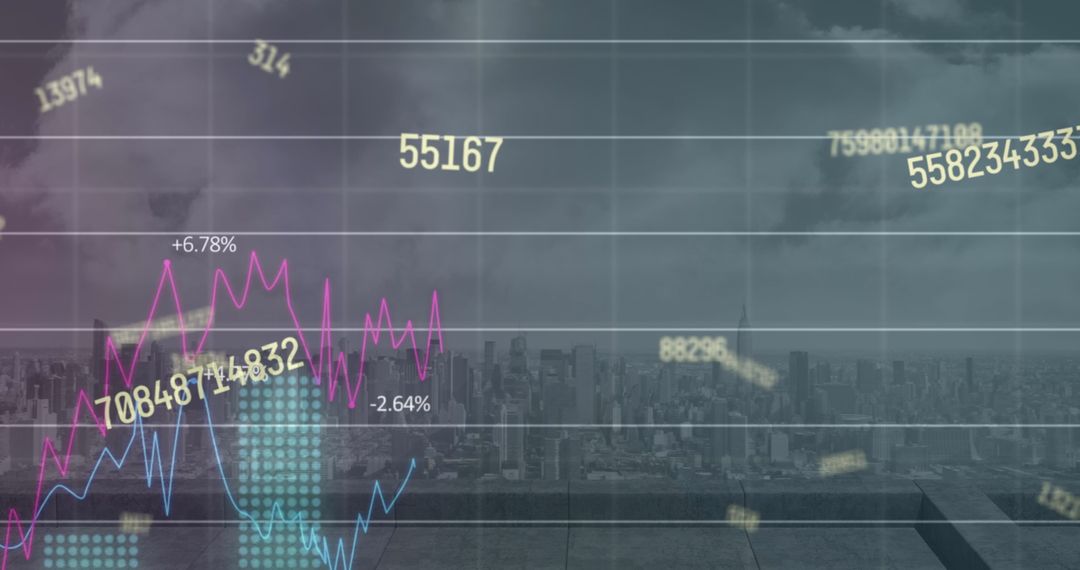
- Transparent Financial Data Overlapping Stock Charts and Maps
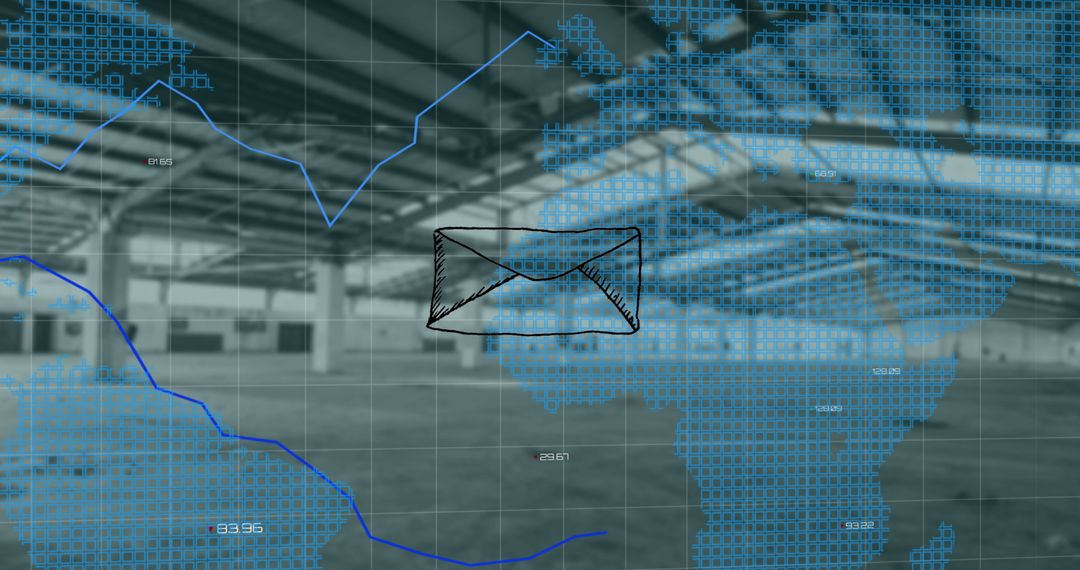
Transparent Financial Data Overlapping Stock Charts and Maps Image

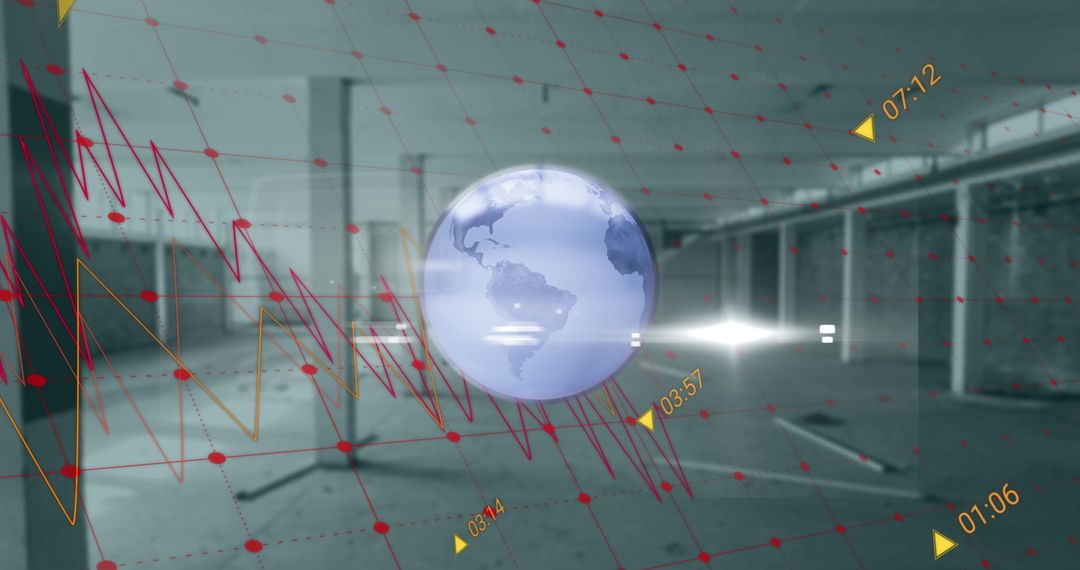
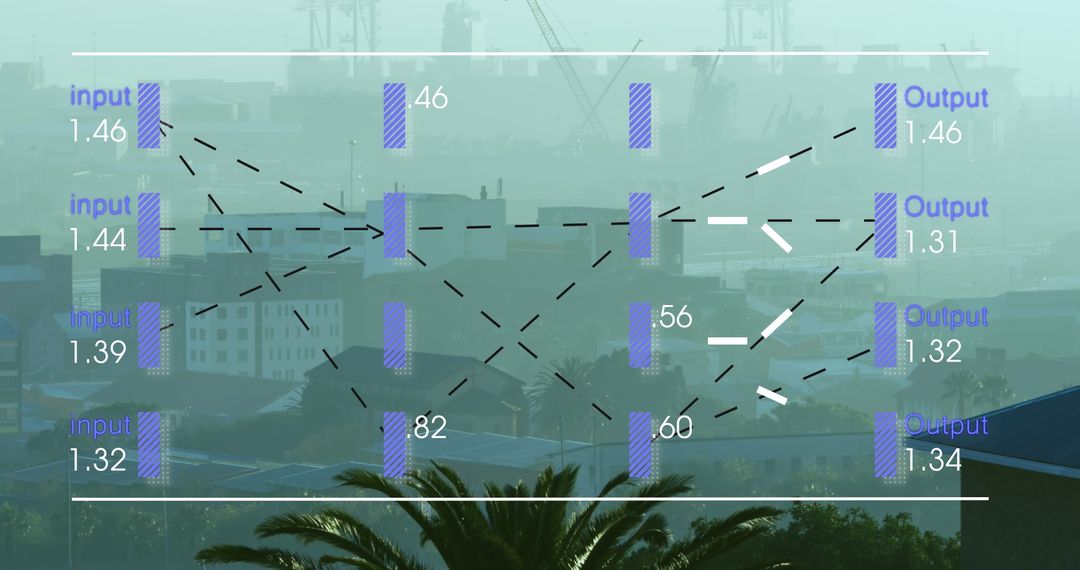
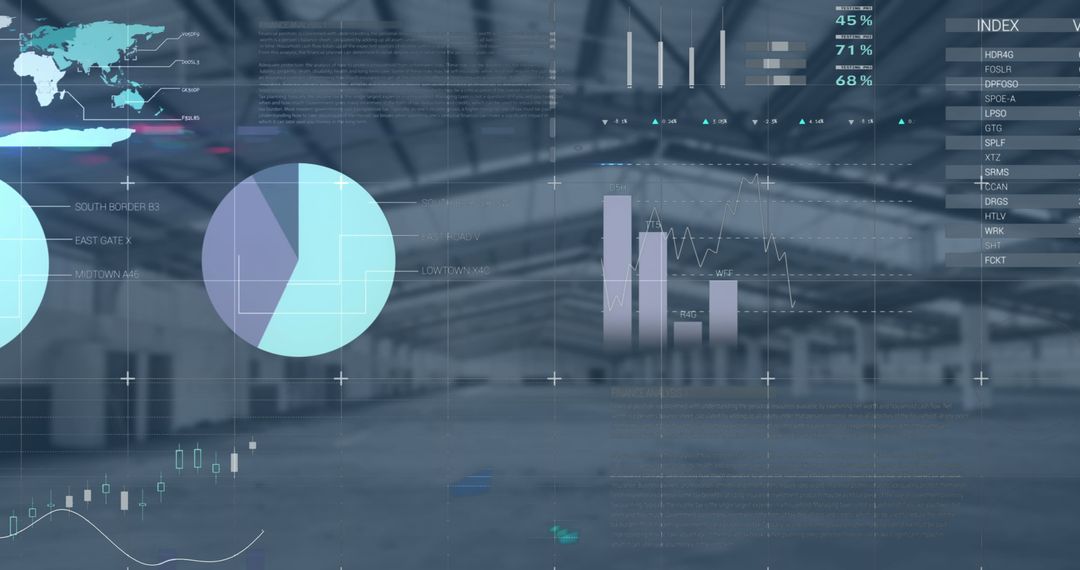
Financial symbols and figures overlay a backdrop of stock charts and world maps, representing complex economic dynamics and analysis trends. Ideal for illustrating concepts of global business strategies, investment forecasting, or economic articles focusing on the interaction between currency markets and logistics.
Powered by  - Get 15% off with code: PIKWIZARD15


2
downloads
downloads
Tags:
More
Credit Photo
If you would like to credit the Photo, here are some ways you can do so
Text Link
photo Link
<span class="text-link">
<span>
<a target="_blank" href=https://pikwizard.com/photo/transparent-financial-data-overlapping-stock-charts-and-maps/2018b5731e804b5c525860c1b414ba71/>PikWizard</a>
</span>
</span>
<span class="image-link">
<span
style="margin: 0 0 20px 0; display: inline-block; vertical-align: middle; width: 100%;"
>
<a
target="_blank"
href="https://pikwizard.com/photo/transparent-financial-data-overlapping-stock-charts-and-maps/2018b5731e804b5c525860c1b414ba71/"
style="text-decoration: none; font-size: 10px; margin: 0;"
>
<img src="https://pikwizard.com/pw/medium/2018b5731e804b5c525860c1b414ba71.jpg" style="margin: 0; width: 100%;" alt="" />
<p style="font-size: 12px; margin: 0;">PikWizard</p>
</a>
</span>
</span>
Free (free of charge)
Free for personal and commercial use.
Author: People Creations
Similar Free Stock Images

Premium


Premium


Premium


Premium


Premium


Premium


Premium


Premium


Premium


Premium


Premium


Premium


Premium


Premium


Premium


Premium


Premium


Premium


Premium


Premium


Premium


Premium


Premium


Premium