- Home >
- Stock Photos >
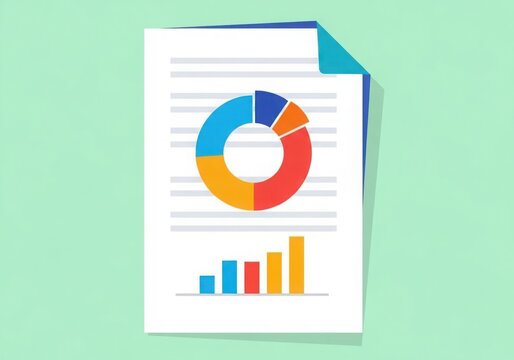
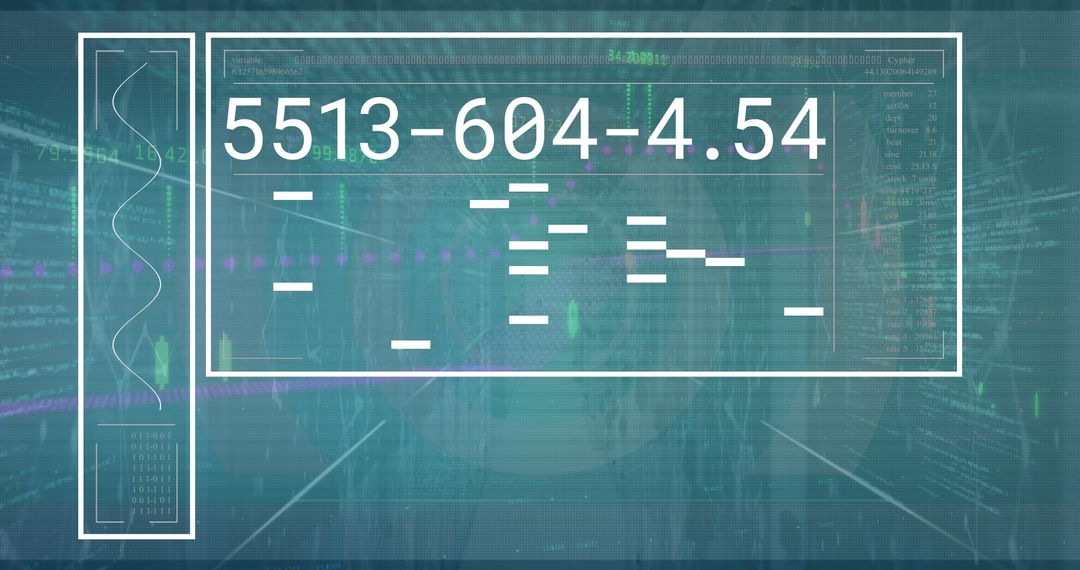
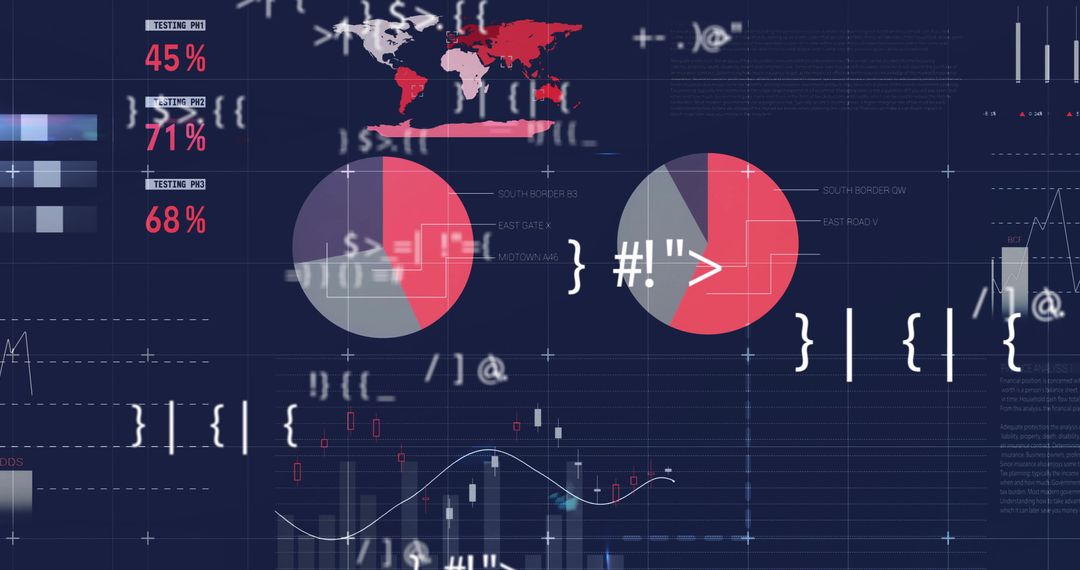
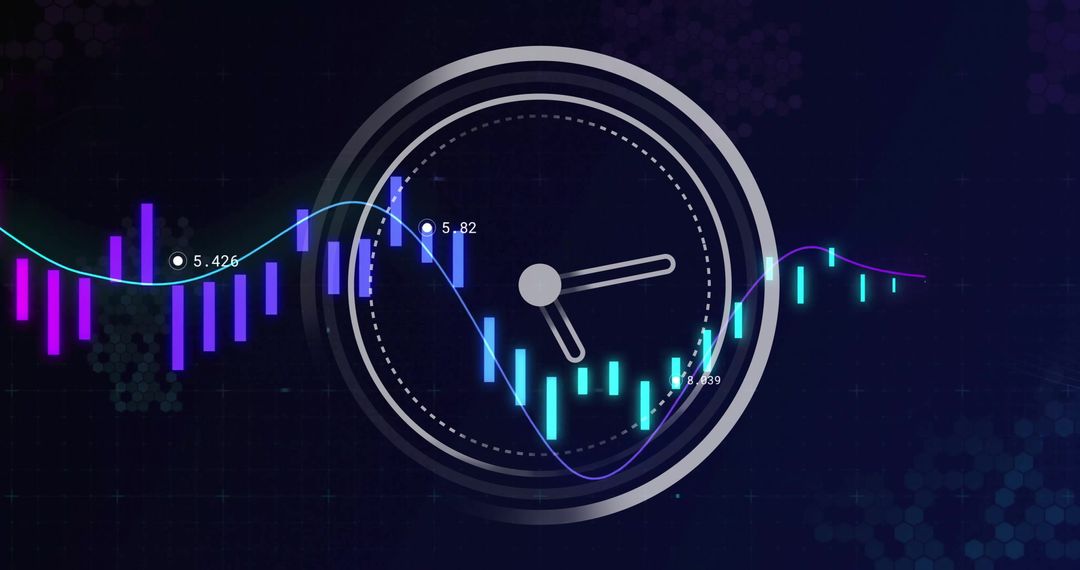
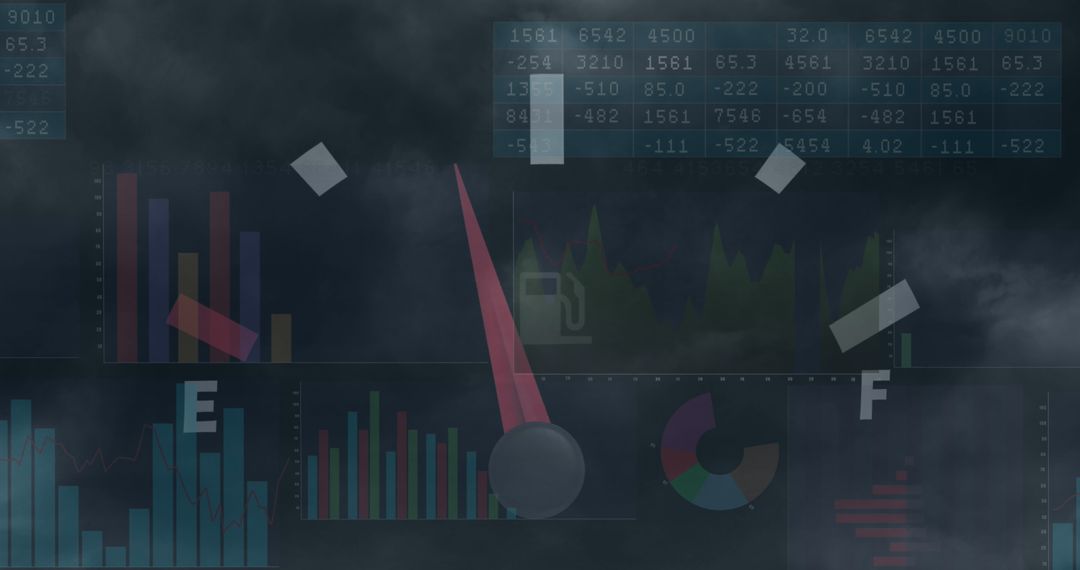
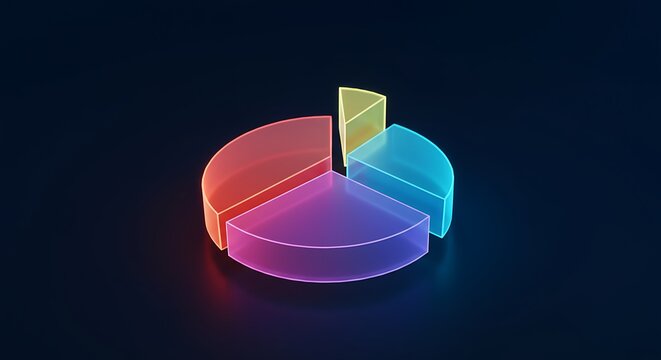
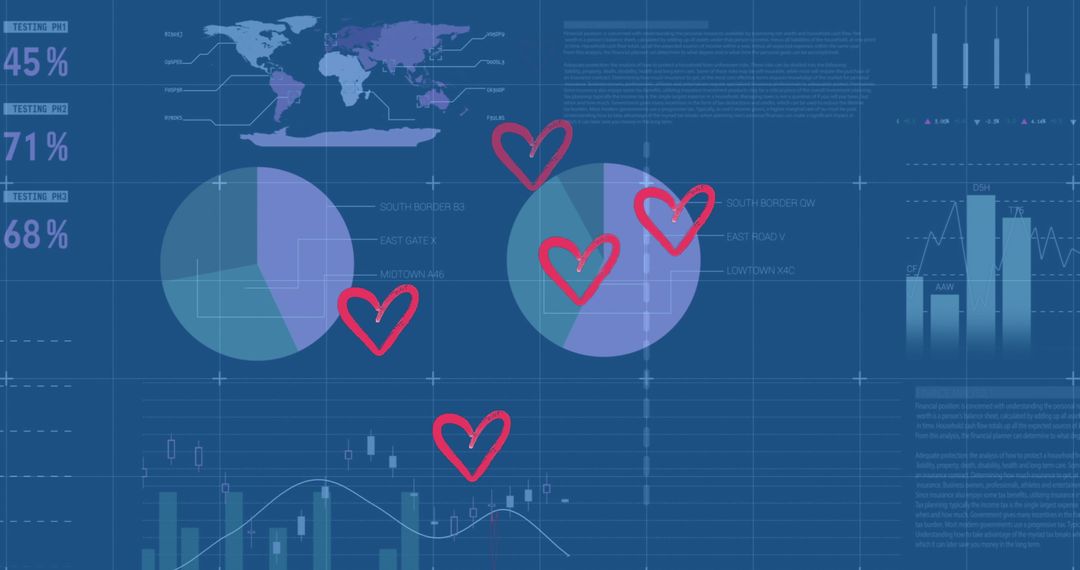
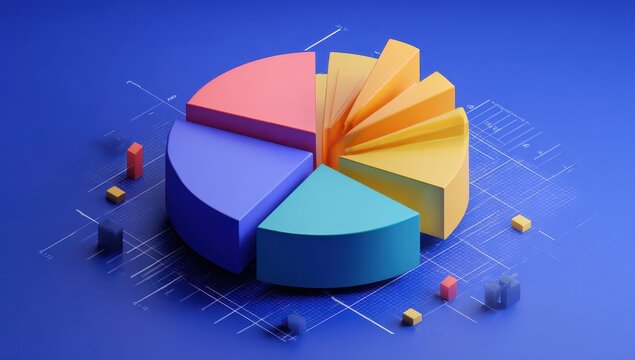
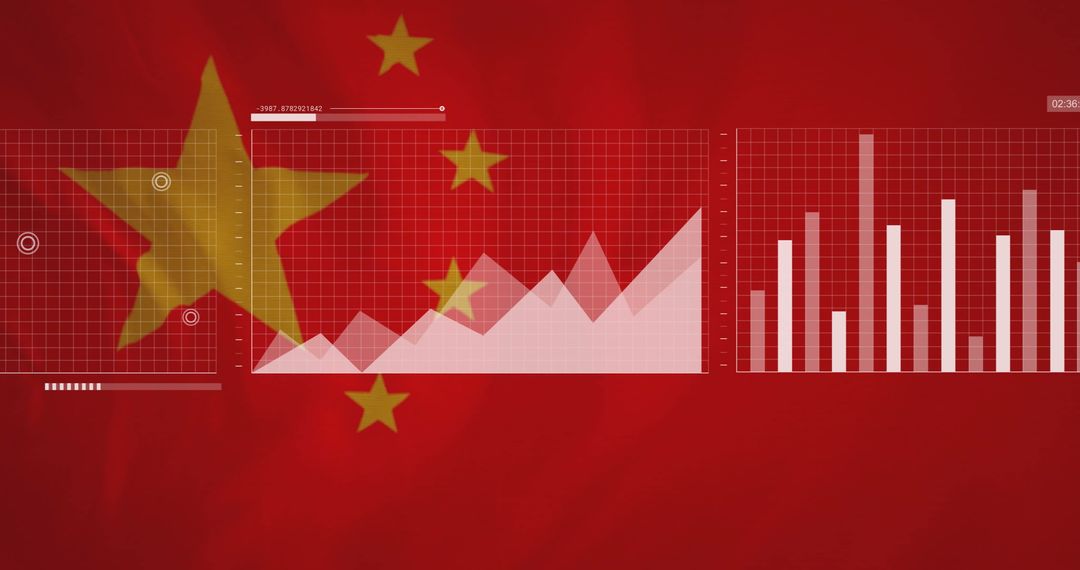
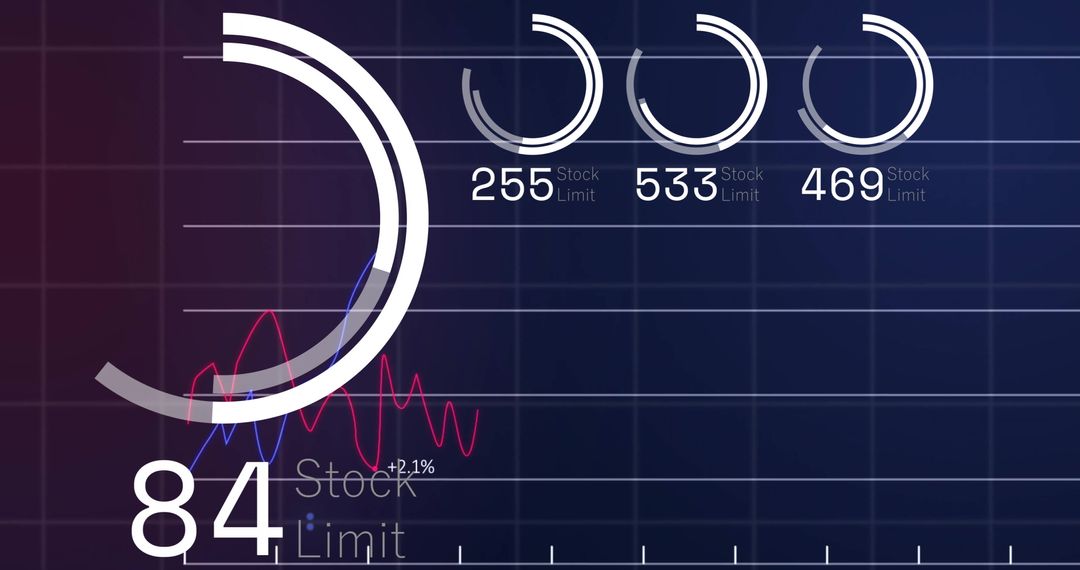
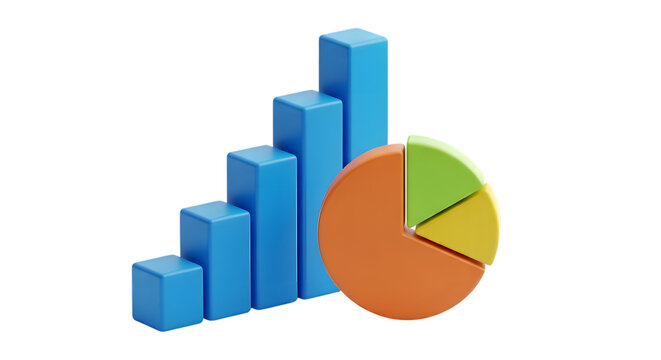
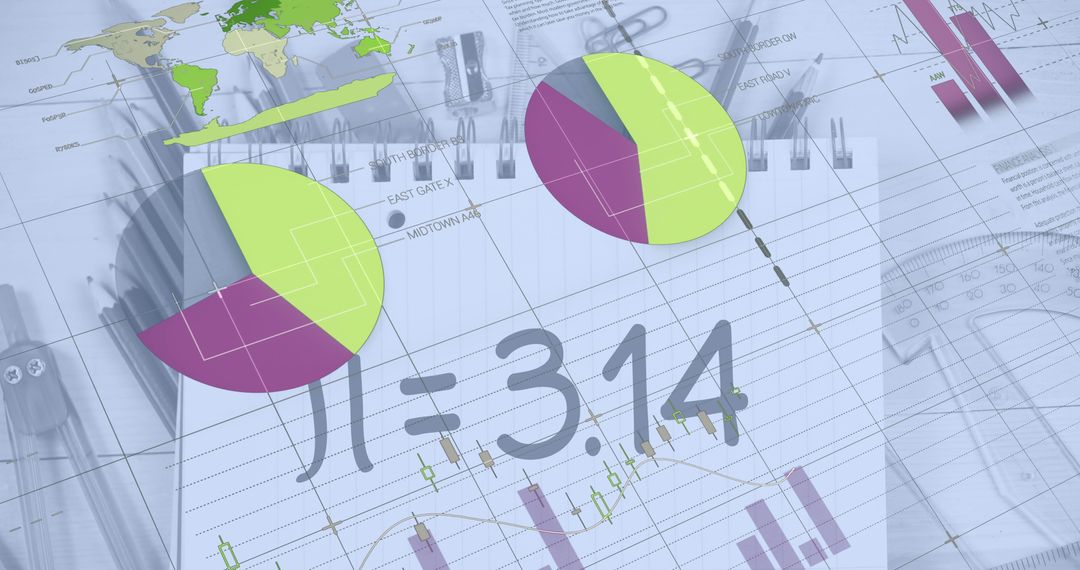
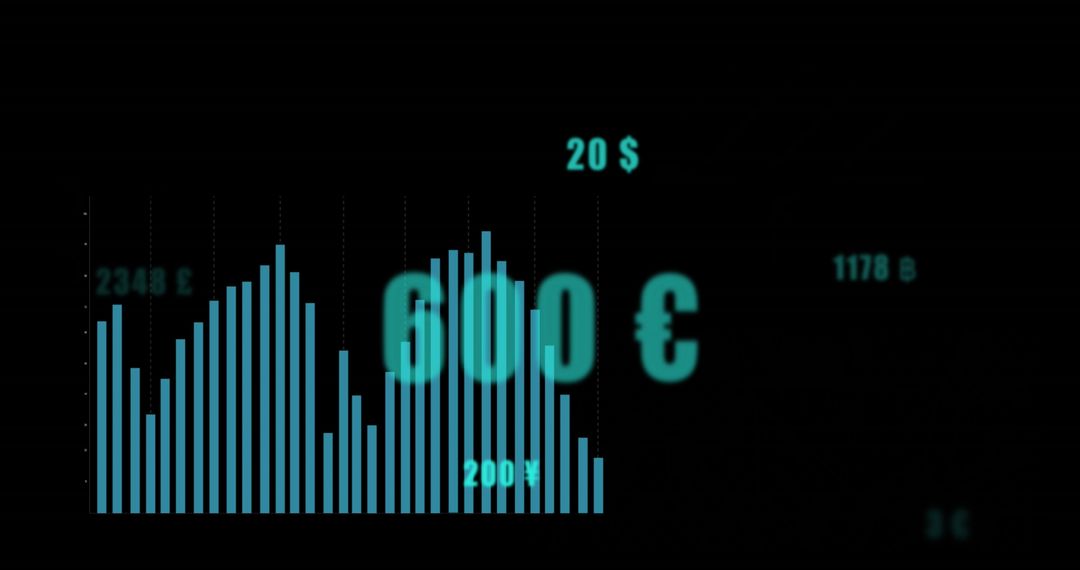
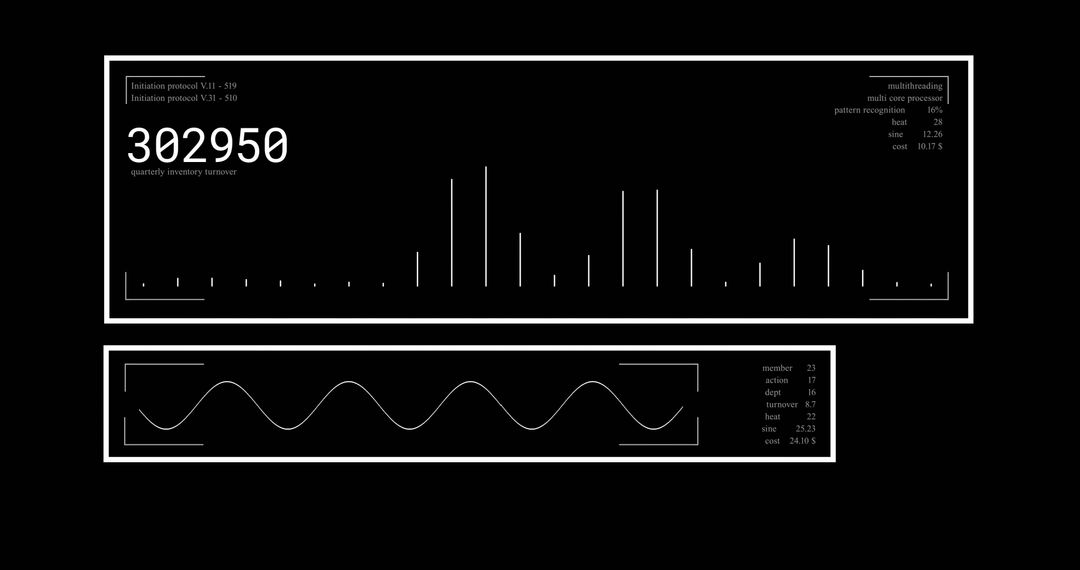
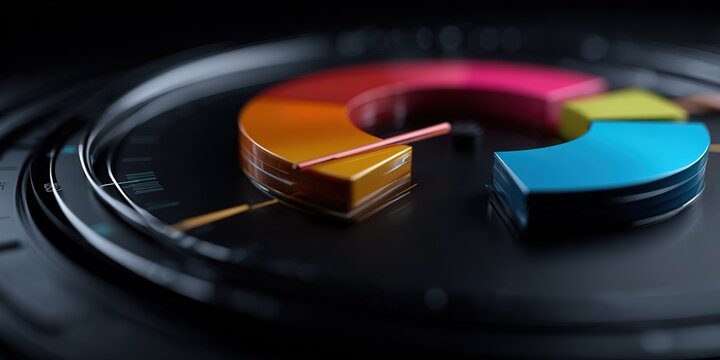
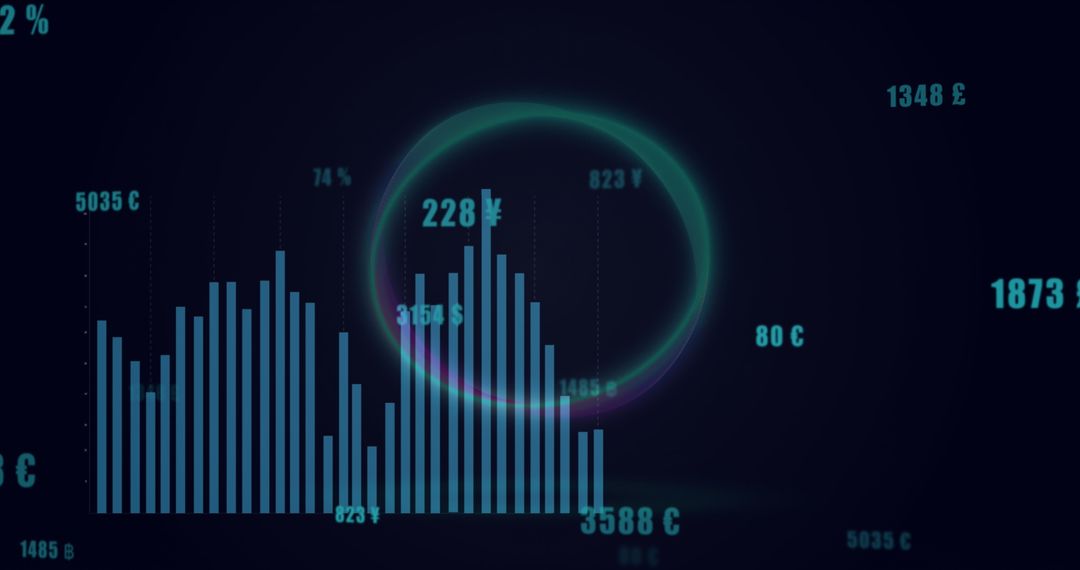
- Transparent Pie Chart with Equalizer Bars on Dark Canvas
Transparent Pie Chart with Equalizer Bars on Dark Canvas Image
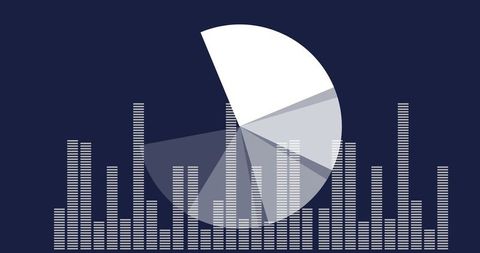
Stylized data visualization with overlapping pie chart and equalizer bars on a dark background, ideal for conveying analytical themes. Suitable for business presentations, technology-focused reports, and educational materials about data analysis and digital tools. The design emphasizes modern, clean illustration styles useful for both print and digital media.
Powered by 


2
downloads
downloads
Tags:
More
Credit Photo
If you would like to credit the Photo, here are some ways you can do so
Text Link
photo Link
<span class="text-link">
<span>
<a target="_blank" href=https://pikwizard.com/photo/transparent-pie-chart-with-equalizer-bars-on-dark-canvas/f6dbb6c95278318afab5360f21d9251a/>PikWizard</a>
</span>
</span>
<span class="image-link">
<span
style="margin: 0 0 20px 0; display: inline-block; vertical-align: middle; width: 100%;"
>
<a
target="_blank"
href="https://pikwizard.com/photo/transparent-pie-chart-with-equalizer-bars-on-dark-canvas/f6dbb6c95278318afab5360f21d9251a/"
style="text-decoration: none; font-size: 10px; margin: 0;"
>
<img src="https://pikwizard.com/pw/medium/f6dbb6c95278318afab5360f21d9251a.jpg" style="margin: 0; width: 100%;" alt="" />
<p style="font-size: 12px; margin: 0;">PikWizard</p>
</a>
</span>
</span>
Free (free of charge)
Free for personal and commercial use.
Author: People Creations
Similar Free Stock Images
Premium


Premium


Premium


Premium


Premium


Premium


Premium


Premium


Premium


Premium


Premium


Premium


Premium


Premium


Premium


Premium


Premium


Premium


Premium


Premium


Premium


Premium


Premium
Premium