
- Home >
- Stock Photos >
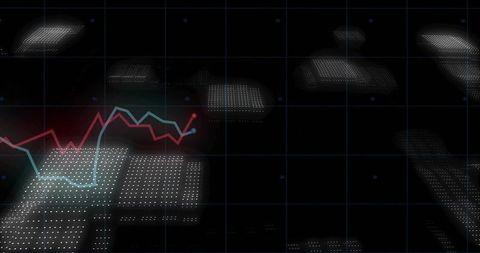
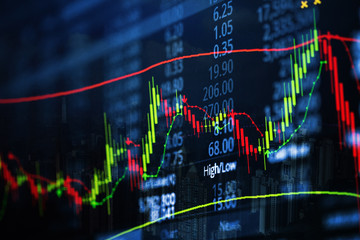
- Trend Analysis with Candlestick Chart and Data Indicators
Trend Analysis with Candlestick Chart and Data Indicators Image

Various fluctuating colored trend lines with candlestick chart and percentage figures illustrate stock market trends and financial trading analytics on a screen. Suitable for use in financial reports, investment presentations, analysis videos, and other economic or financial education content.
Powered by 


downloads
Tags:
More
Credit Photo
If you would like to credit the Photo, here are some ways you can do so
Text Link
photo Link
<span class="text-link">
<span>
<a target="_blank" href=https://pikwizard.com/photo/trend-analysis-with-candlestick-chart-and-data-indicators/d7cb22e449e54e14192341d413f4bf0a/>PikWizard</a>
</span>
</span>
<span class="image-link">
<span
style="margin: 0 0 20px 0; display: inline-block; vertical-align: middle; width: 100%;"
>
<a
target="_blank"
href="https://pikwizard.com/photo/trend-analysis-with-candlestick-chart-and-data-indicators/d7cb22e449e54e14192341d413f4bf0a/"
style="text-decoration: none; font-size: 10px; margin: 0;"
>
<img src="https://pikwizard.com/pw/medium/d7cb22e449e54e14192341d413f4bf0a.jpg" style="margin: 0; width: 100%;" alt="" />
<p style="font-size: 12px; margin: 0;">PikWizard</p>
</a>
</span>
</span>
Free (free of charge)
Free for personal and commercial use.
Author: Awesome Content
Similar Free Stock Images

Premium


Premium


Premium


Premium


Premium


Premium


Premium

Premium


Premium

Premium

Premium

Premium


Premium


Premium


Premium

Premium


Premium


Premium
Premium


Premium

Premium


Premium


Premium


Premium


Premium


Explore More Free Stock Images