- Home >
- Stock Photos >
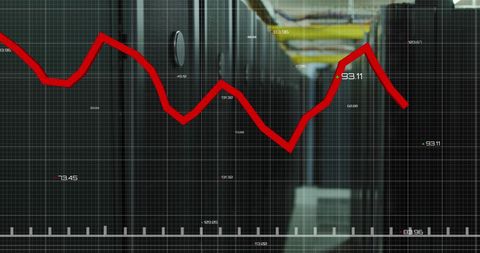
- Unattended Office with Financial Graph Overlay Concept
Unattended Office with Financial Graph Overlay Concept Image

Digitally created visualization showing financial data applied over an empty office table. The fluctuating graph line in vibrant green represents financial growth and trends, ideal for presentations about business projections and market analysis strategies. This could be used in scenarios to illustrate data-driven decision-making and corporate meetings regarding profit forecasts.
Powered by 


downloads
Tags:
More
Credit Photo
If you would like to credit the Photo, here are some ways you can do so
Text Link
photo Link
<span class="text-link">
<span>
<a target="_blank" href=https://pikwizard.com/photo/unattended-office-with-financial-graph-overlay-concept/182996c18effe0823274416331d218df/>PikWizard</a>
</span>
</span>
<span class="image-link">
<span
style="margin: 0 0 20px 0; display: inline-block; vertical-align: middle; width: 100%;"
>
<a
target="_blank"
href="https://pikwizard.com/photo/unattended-office-with-financial-graph-overlay-concept/182996c18effe0823274416331d218df/"
style="text-decoration: none; font-size: 10px; margin: 0;"
>
<img src="https://pikwizard.com/pw/medium/182996c18effe0823274416331d218df.jpg" style="margin: 0; width: 100%;" alt="" />
<p style="font-size: 12px; margin: 0;">PikWizard</p>
</a>
</span>
</span>
Free (free of charge)
Free for personal and commercial use.
Author: People Creations
Similar Free Stock Images
Loading...

Premium


Premium


Premium


Premium


Premium


Premium


Premium


Premium


Premium

Premium


Premium

Premium


Premium

Premium


Premium


Premium


Premium


Premium


Premium


Premium


Premium


Premium


Premium


Premium

Premium