- Home >
- Stock Photos >
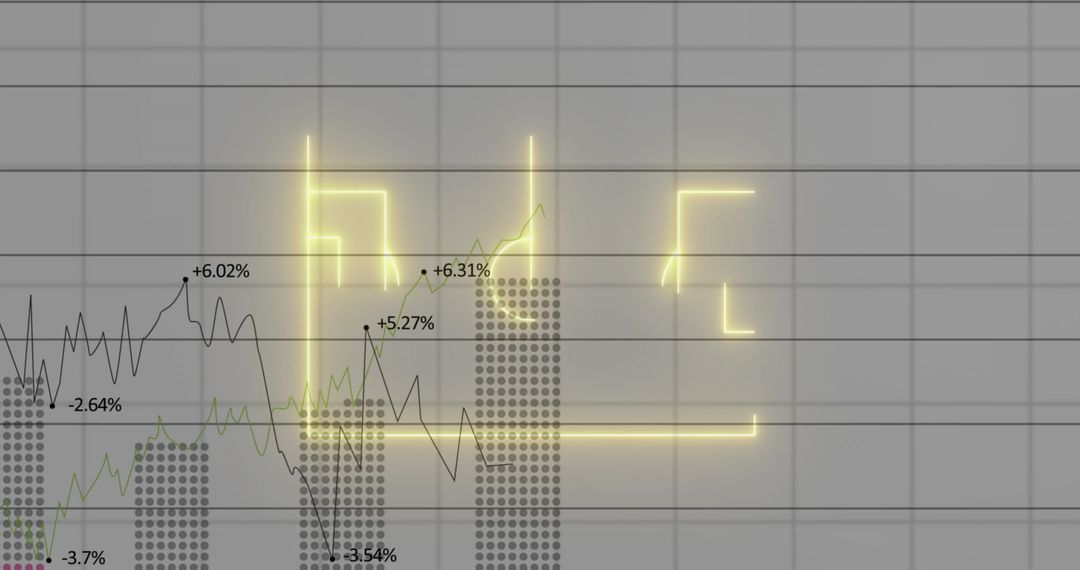
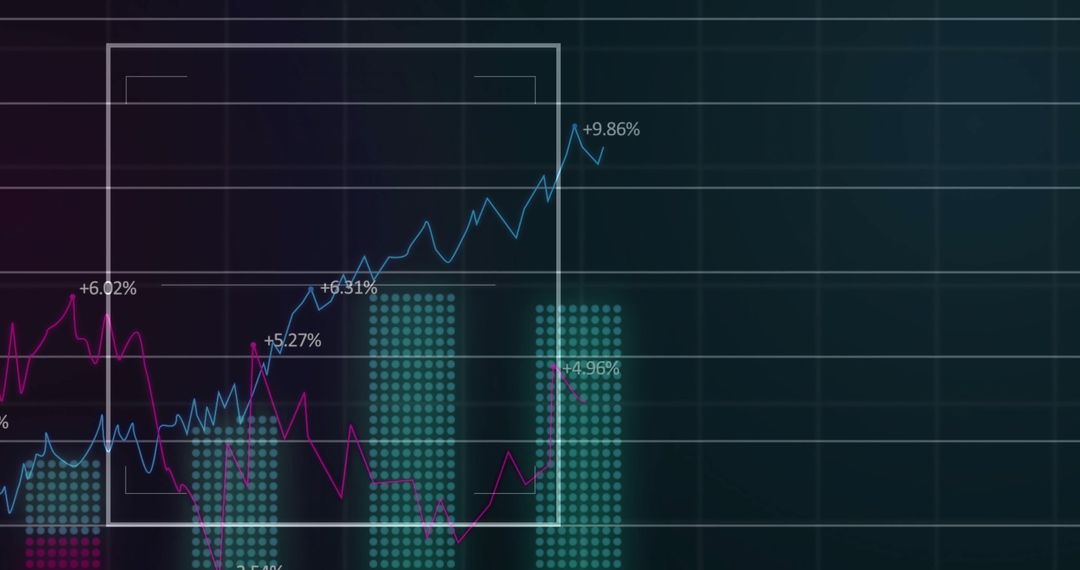
- Undulating Maroon Line on Pink Grid Background Signifying Data Trends
Undulating Maroon Line on Pink Grid Background Signifying Data Trends Image

AI Generated Image. Graph line visualizing data trends on pink shaded grid ideal for presentations and reports about analytics, forecasts, fluctuations, growth dynamics, or economic indicators. Use in business dashboards or infographic designs.
Powered by 


0
downloads
downloads
Tags:
More
Credit Photo
If you would like to credit the Photo, here are some ways you can do so
Text Link
photo Link
<span class="text-link">
<span>
<a target="_blank" href=https://pikwizard.com/photo/undulating-maroon-line-on-pink-grid-background-signifying-data-trends/fdbb3552f5da3ab05a5a9c8dc6faf75a/>PikWizard</a>
</span>
</span>
<span class="image-link">
<span
style="margin: 0 0 20px 0; display: inline-block; vertical-align: middle; width: 100%;"
>
<a
target="_blank"
href="https://pikwizard.com/photo/undulating-maroon-line-on-pink-grid-background-signifying-data-trends/fdbb3552f5da3ab05a5a9c8dc6faf75a/"
style="text-decoration: none; font-size: 10px; margin: 0;"
>
<img src="https://pikwizard.com/pw/medium/fdbb3552f5da3ab05a5a9c8dc6faf75a.jpg" style="margin: 0; width: 100%;" alt="" />
<p style="font-size: 12px; margin: 0;">PikWizard</p>
</a>
</span>
</span>
Free (free of charge)
Free for personal and commercial use.
Author: AI Creator
Similar Free Stock Images