
- Home >
- Stock Photos >
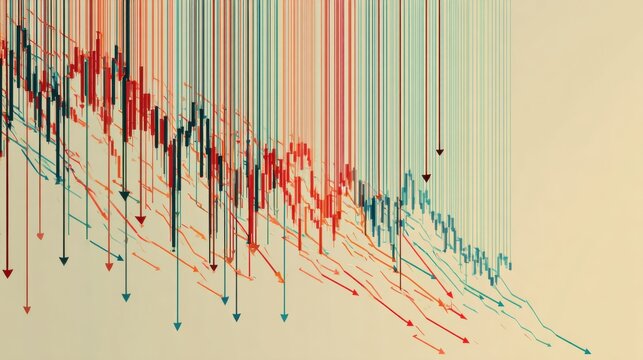
- Upward Stock Market Arrow with Binary Code Background
Upward Stock Market Arrow with Binary Code Background Image

Visualization of financial growth showing stock market dynamics with a green upward arrow. Overlaid against a backdrop of binary code, this illustration represents data-driven trading and analytics. Useful for websites, articles, and presentations on financial investment, economic trends, and digital trading platforms.
Powered by 


downloads
Tags:
More
Credit Photo
If you would like to credit the Photo, here are some ways you can do so
Text Link
photo Link
<span class="text-link">
<span>
<a target="_blank" href=https://pikwizard.com/photo/upward-stock-market-arrow-with-binary-code-background/301c1e7107bbef3c709e3ac4970f990f/>PikWizard</a>
</span>
</span>
<span class="image-link">
<span
style="margin: 0 0 20px 0; display: inline-block; vertical-align: middle; width: 100%;"
>
<a
target="_blank"
href="https://pikwizard.com/photo/upward-stock-market-arrow-with-binary-code-background/301c1e7107bbef3c709e3ac4970f990f/"
style="text-decoration: none; font-size: 10px; margin: 0;"
>
<img src="https://pikwizard.com/pw/medium/301c1e7107bbef3c709e3ac4970f990f.jpg" style="margin: 0; width: 100%;" alt="" />
<p style="font-size: 12px; margin: 0;">PikWizard</p>
</a>
</span>
</span>
Free (free of charge)
Free for personal and commercial use.
Author: Authentic Images
Similar Free Stock Images

Premium


Premium


Premium


Premium


Premium


Premium


Premium


Premium


Premium


Premium


Premium


Premium


Premium


Premium


Premium

Premium

Premium


Premium


Premium


Premium

Premium

Premium


Premium


Premium

Premium


Explore More Free Stock Images