- Home >
- Stock Photos >
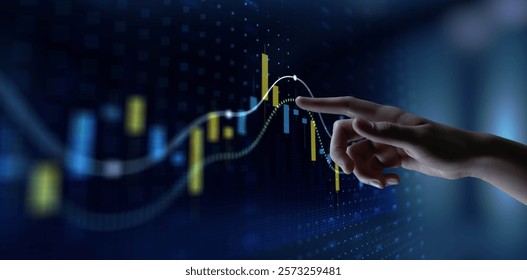
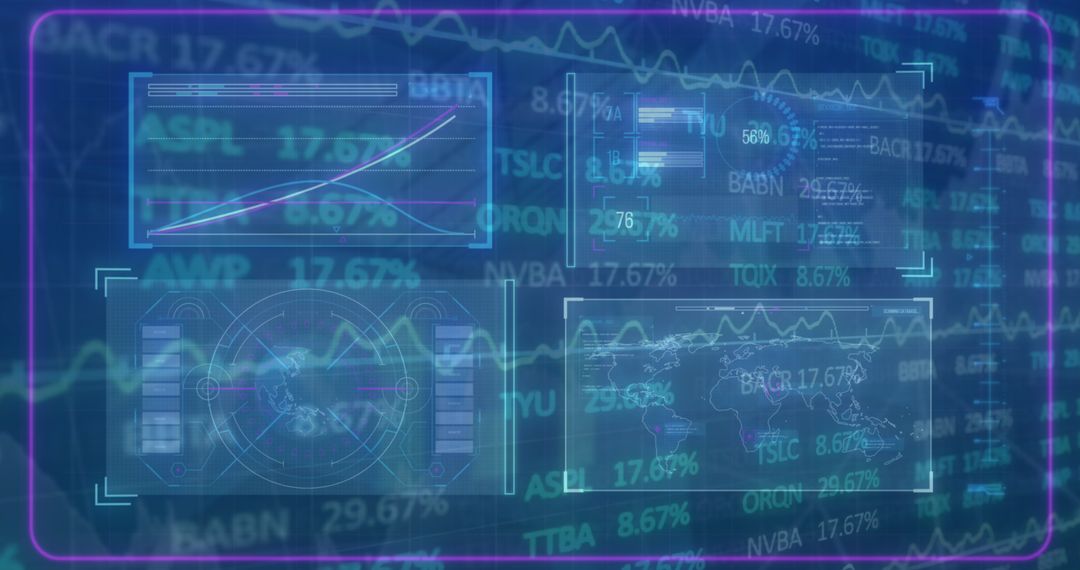
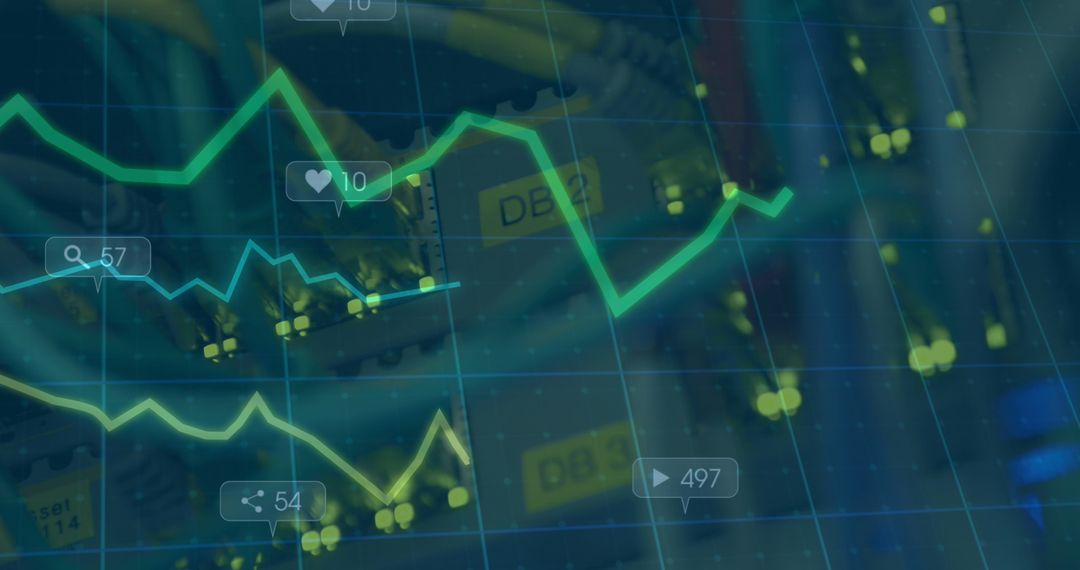
- Upward Trend in Financial Data Dashboard with Graphs and Analytics
Upward Trend in Financial Data Dashboard with Graphs and Analytics Image

Visual displaying an upward-trending graph on a dark grid background, generating a modern and high-tech aesthetic. It illustrates data panels, numbers, and teal arrows, signifying analysis and growth in a financial context. Useful for conveying finance, technology, and business intelligence themes, ideal for financial presentations, articles on market trends, or technological advancements.
Powered by  - Get 15% off with code: PIKWIZARD15


0
downloads
downloads
Tags:
More
Credit Photo
If you would like to credit the Photo, here are some ways you can do so
Text Link
photo Link
<span class="text-link">
<span>
<a target="_blank" href=https://pikwizard.com/photo/upward-trend-in-financial-data-dashboard-with-graphs-and-analytics/b25ea269a4023208846532bedd913f18/>PikWizard</a>
</span>
</span>
<span class="image-link">
<span
style="margin: 0 0 20px 0; display: inline-block; vertical-align: middle; width: 100%;"
>
<a
target="_blank"
href="https://pikwizard.com/photo/upward-trend-in-financial-data-dashboard-with-graphs-and-analytics/b25ea269a4023208846532bedd913f18/"
style="text-decoration: none; font-size: 10px; margin: 0;"
>
<img src="https://pikwizard.com/pw/medium/b25ea269a4023208846532bedd913f18.jpg" style="margin: 0; width: 100%;" alt="" />
<p style="font-size: 12px; margin: 0;">PikWizard</p>
</a>
</span>
</span>
Free (free of charge)
Free for personal and commercial use.
Author: Awesome Content
Similar Free Stock Images

Premium


Premium


Premium


Premium


Premium


Premium


Premium


Premium


Premium


Premium


Premium


Premium


Premium


Premium


Premium


Premium


Premium


Premium


Premium


Premium


Premium


Premium


Premium


Premium