
- Home >
- Stock Photos >
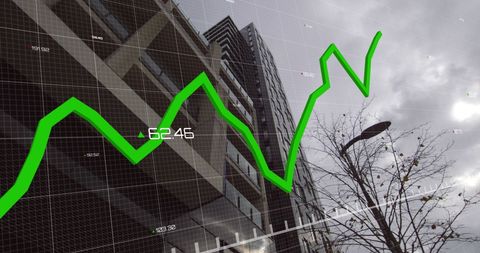
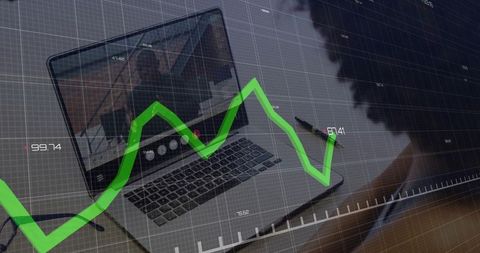
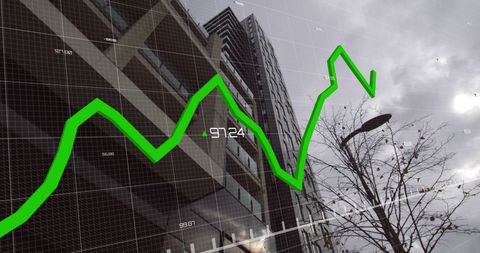
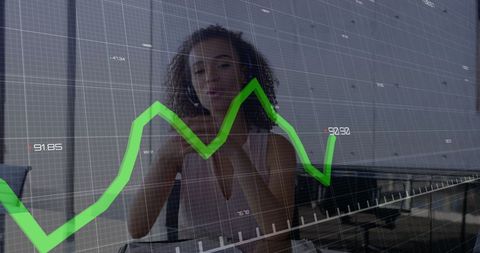
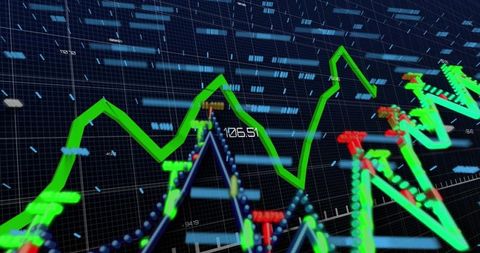
- Upward Trending Green Line on Digital Financial Dashboard
Upward Trending Green Line on Digital Financial Dashboard Image

Illustration of a green line trending upward on an advanced financial dashboard. Includes numeric overlays and code elements, symbolizing technological integration in data analytics. Perfect for websites and publications related to finance, investment, stock market trends, data analysis, and technological advancement in financial services. Use this image for presentations on digital innovation and insights in financial growth strategies.
Powered by  - Get 15% off with code: PIKWIZARD15


downloads
Tags:
More
Credit Photo
If you would like to credit the Photo, here are some ways you can do so
Text Link
photo Link
<span class="text-link">
<span>
<a target="_blank" href=https://pikwizard.com/photo/upward-trending-green-line-on-digital-financial-dashboard/bdf55ade0388f356b7073588839c4f7e/>PikWizard</a>
</span>
</span>
<span class="image-link">
<span
style="margin: 0 0 20px 0; display: inline-block; vertical-align: middle; width: 100%;"
>
<a
target="_blank"
href="https://pikwizard.com/photo/upward-trending-green-line-on-digital-financial-dashboard/bdf55ade0388f356b7073588839c4f7e/"
style="text-decoration: none; font-size: 10px; margin: 0;"
>
<img src="https://pikwizard.com/pw/medium/bdf55ade0388f356b7073588839c4f7e.jpg" style="margin: 0; width: 100%;" alt="" />
<p style="font-size: 12px; margin: 0;">PikWizard</p>
</a>
</span>
</span>
Free (free of charge)
Free for personal and commercial use.
Author: People Creations
Similar Free Stock Images
Loading...

Premium

Premium


Premium


Premium


Premium


Premium


Premium


Premium


Premium

Premium


Premium

Premium

Premium


Premium

Premium


Premium

Premium


Premium


Premium


Premium

Premium


Premium


Premium


Premium


Premium


Explore More Free Stock Images