- Home >
- Stock Photos >
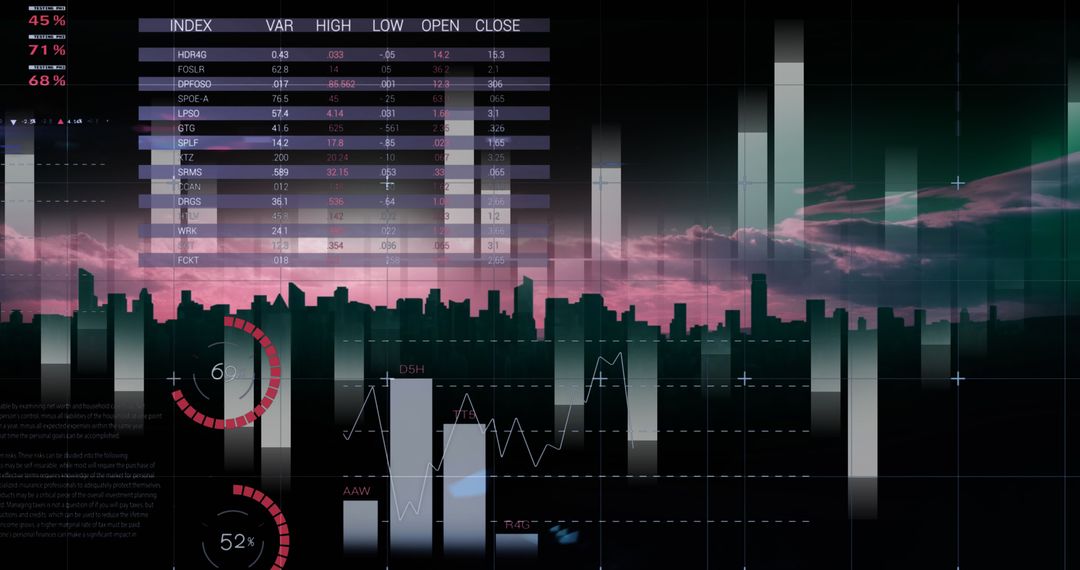
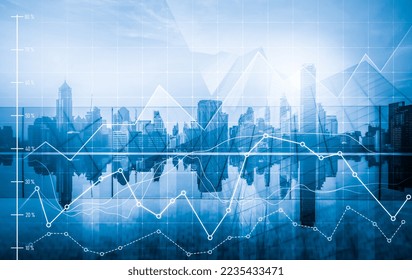
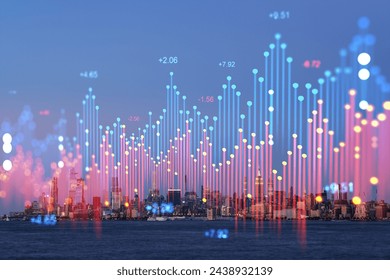
- Urban Cityscape with Financial Graphs and Data Integration
Urban Cityscape with Financial Graphs and Data Integration Image

Silhouetted cityscape overlays financial graphs showing market trends and data points, symbolizing integration of urban development with global finance. Ideal for illustrating economic growth concepts, investment strategies, or urbanization impacts. Suitable for business presentations, market analysis reports, and financial advisory publications.
Powered by  - Get 15% off with code: PIKWIZARD15


2
downloads
downloads
Tags:
More
Credit Photo
If you would like to credit the Photo, here are some ways you can do so
Text Link
photo Link
<span class="text-link">
<span>
<a target="_blank" href=https://pikwizard.com/photo/urban-cityscape-with-financial-graphs-and-data-integration/c4b882b40bb4964a63c56ab08fd62f59/>PikWizard</a>
</span>
</span>
<span class="image-link">
<span
style="margin: 0 0 20px 0; display: inline-block; vertical-align: middle; width: 100%;"
>
<a
target="_blank"
href="https://pikwizard.com/photo/urban-cityscape-with-financial-graphs-and-data-integration/c4b882b40bb4964a63c56ab08fd62f59/"
style="text-decoration: none; font-size: 10px; margin: 0;"
>
<img src="https://pikwizard.com/pw/medium/c4b882b40bb4964a63c56ab08fd62f59.jpg" style="margin: 0; width: 100%;" alt="" />
<p style="font-size: 12px; margin: 0;">PikWizard</p>
</a>
</span>
</span>
Free (free of charge)
Free for personal and commercial use.
Author: People Creations
Similar Free Stock Images

Premium


Premium


Premium


Premium


Premium


Premium


Premium


Premium


Premium


Premium


Premium


Premium


Premium


Premium


Premium


Premium


Premium


Premium


Premium


Premium


Premium


Premium


Premium


Premium