- Home >
- Stock Photos >
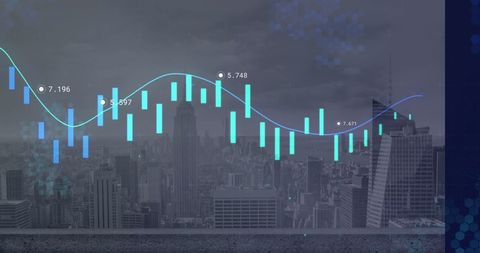
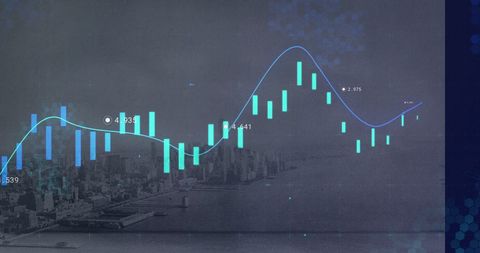
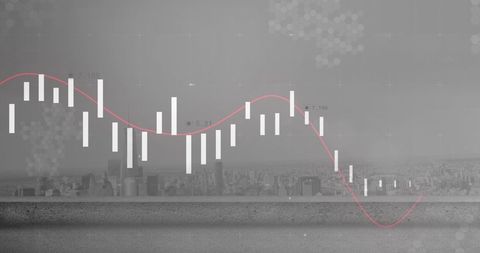
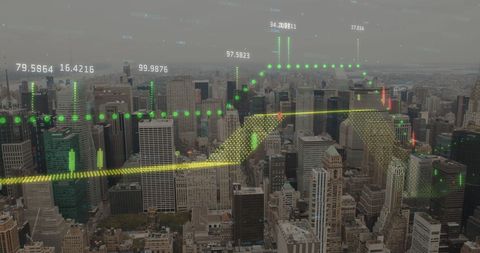
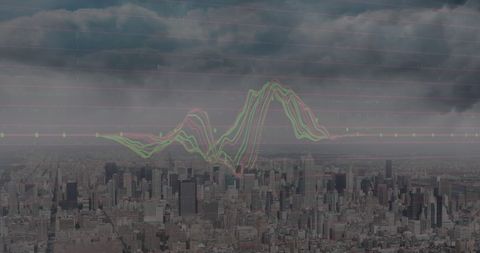
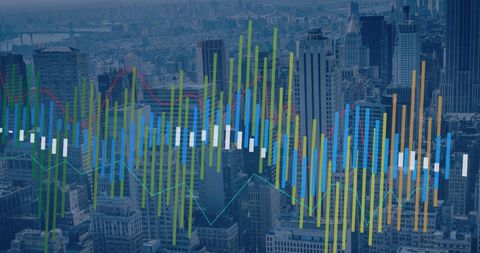
- Urban Financial Data Visualization with Overlaid Stock Chart
Urban Financial Data Visualization with Overlaid Stock Chart Image

Overlay showing financial data processing amidst city buildings, suggesting a dynamic urban economy and business activity. Suitable for content about global finance, market trends, and investment strategies. Ideal for articles, presentations, and reports related to data analysis, business development, and economic forecasting.

downloads
Tags:
More
Credit Photo
If you would like to credit the Photo, here are some ways you can do so
Text Link
photo Link
<span class="text-link">
<span>
<a target="_blank" href=https://pikwizard.com/photo/urban-financial-data-visualization-with-overlaid-stock-chart/c040a277c19b42de8cdaaef267d8e1f3/>PikWizard</a>
</span>
</span>
<span class="image-link">
<span
style="margin: 0 0 20px 0; display: inline-block; vertical-align: middle; width: 100%;"
>
<a
target="_blank"
href="https://pikwizard.com/photo/urban-financial-data-visualization-with-overlaid-stock-chart/c040a277c19b42de8cdaaef267d8e1f3/"
style="text-decoration: none; font-size: 10px; margin: 0;"
>
<img src="https://pikwizard.com/pw/medium/c040a277c19b42de8cdaaef267d8e1f3.jpg" style="margin: 0; width: 100%;" alt="" />
<p style="font-size: 12px; margin: 0;">PikWizard</p>
</a>
</span>
</span>
Free (free of charge)
Free for personal and commercial use.
Author: Awesome Content