
- Home >
- Stock Photos >
- Urban Skyline with 3D Data Visualization and Analytics
Urban Skyline with 3D Data Visualization and Analytics Image
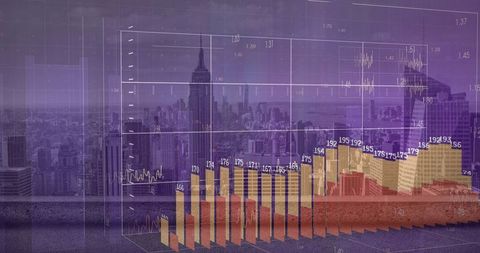
3D bars and line charts are superimposed on an expansive urban skyline featuring iconic buildings, suggesting technological innovation and high-tech analytics. Perfect for illustrating concepts in business intelligence, graphical analysis, or data-driven urban development projects. Suitable for corporate presentations, tech industry reports, or articles on city planning trends.
Powered by 


downloads
Tags:
More
Credit Photo
If you would like to credit the Photo, here are some ways you can do so
Text Link
photo Link
<span class="text-link">
<span>
<a target="_blank" href=https://pikwizard.com/photo/urban-skyline-with-3d-data-visualization-and-analytics/abc2b0932977b9099e29129331f1955d/>PikWizard</a>
</span>
</span>
<span class="image-link">
<span
style="margin: 0 0 20px 0; display: inline-block; vertical-align: middle; width: 100%;"
>
<a
target="_blank"
href="https://pikwizard.com/photo/urban-skyline-with-3d-data-visualization-and-analytics/abc2b0932977b9099e29129331f1955d/"
style="text-decoration: none; font-size: 10px; margin: 0;"
>
<img src="https://pikwizard.com/pw/medium/abc2b0932977b9099e29129331f1955d.jpg" style="margin: 0; width: 100%;" alt="" />
<p style="font-size: 12px; margin: 0;">PikWizard</p>
</a>
</span>
</span>
Free (free of charge)
Free for personal and commercial use.
Author: People Creations