- Home >
- Stock Photos >
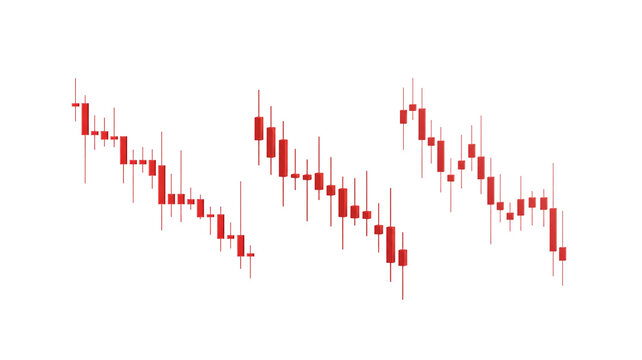
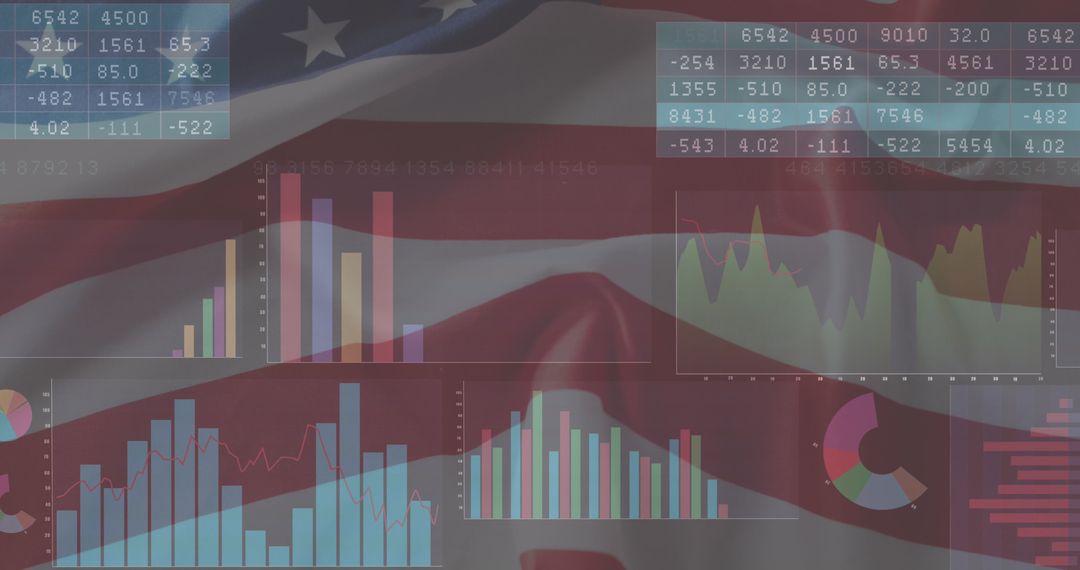
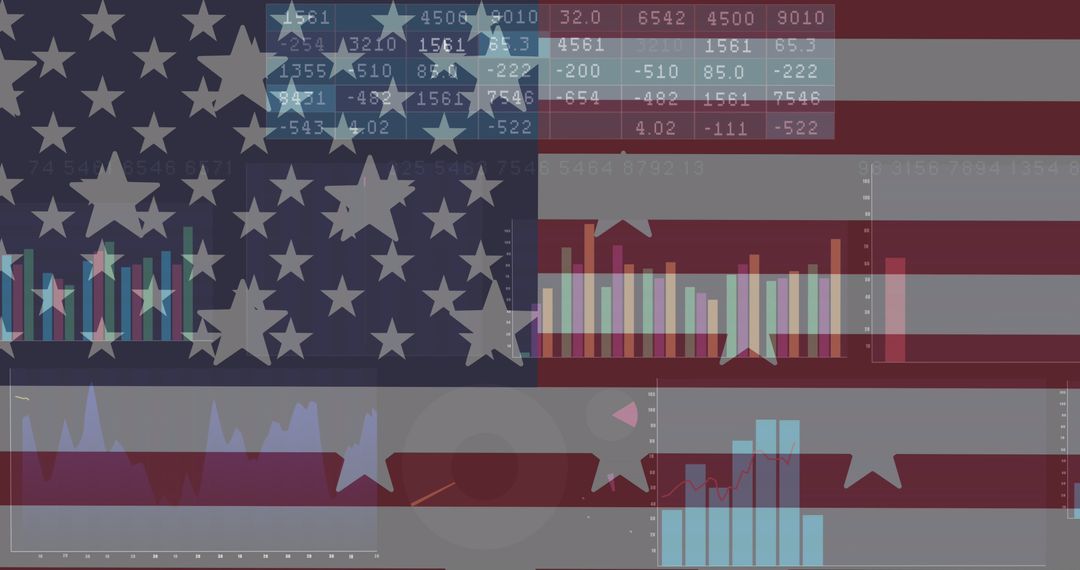
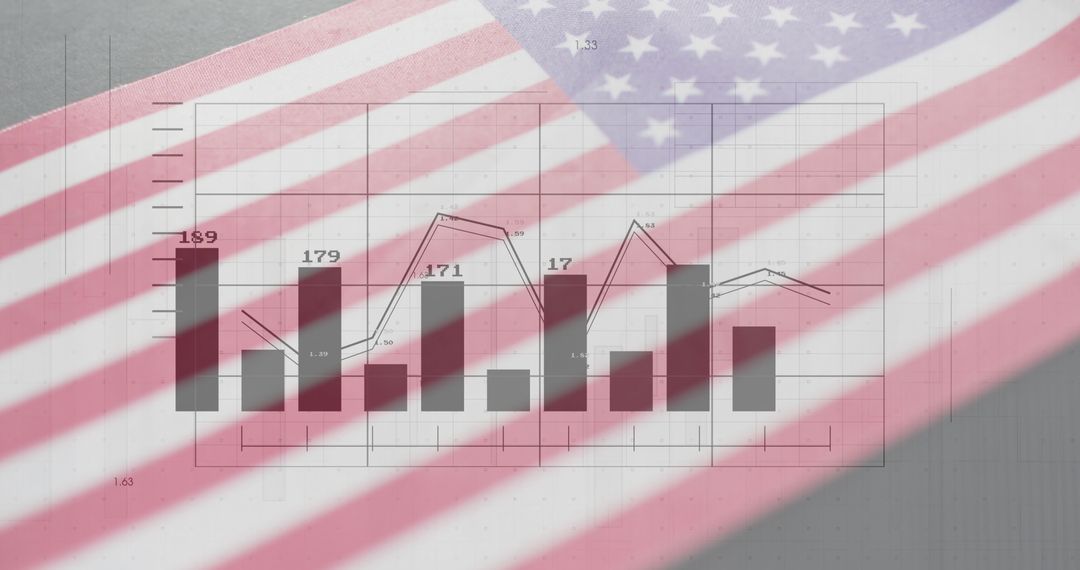
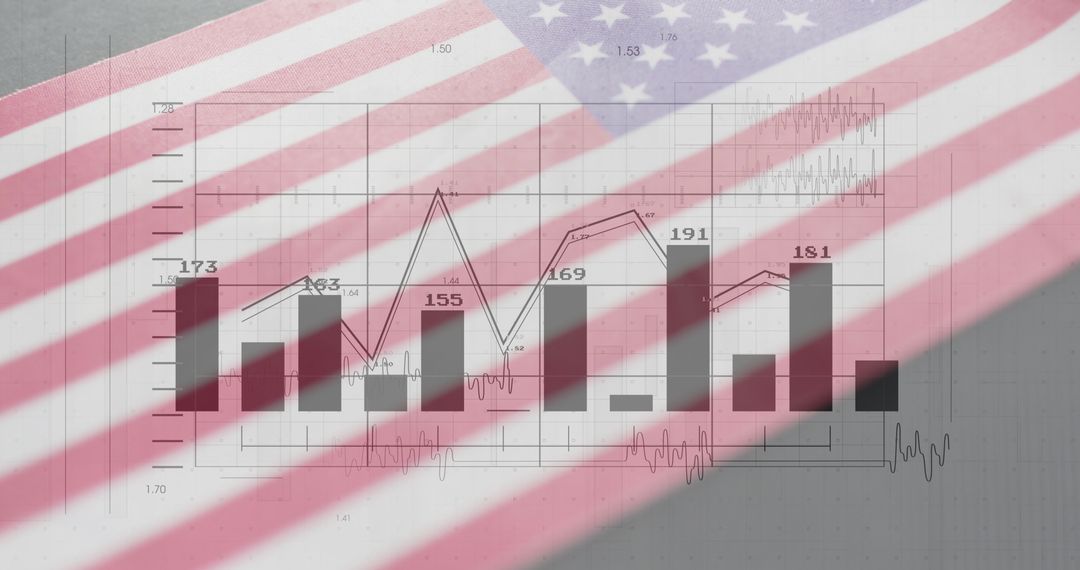
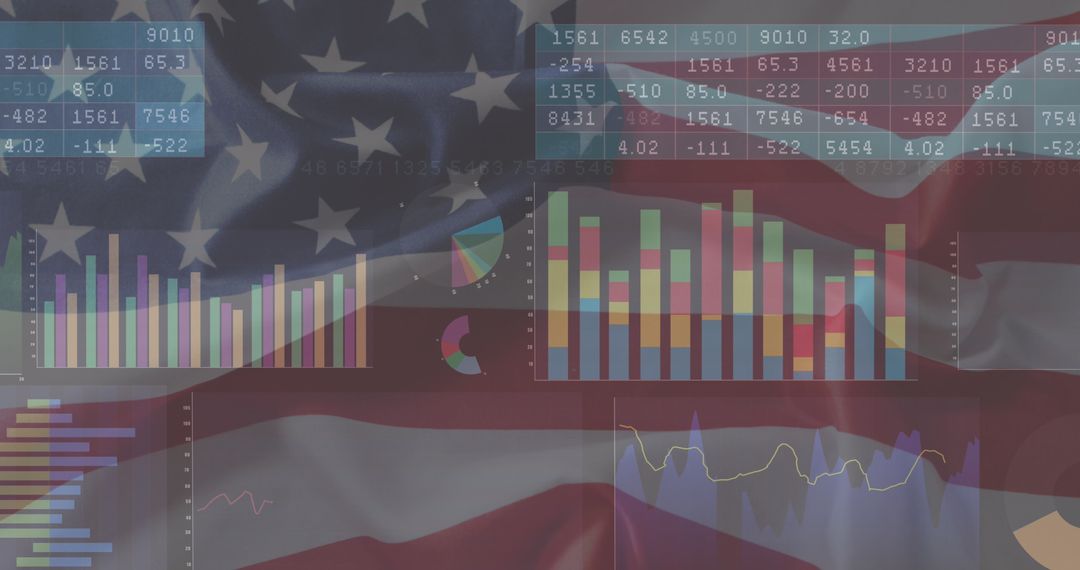
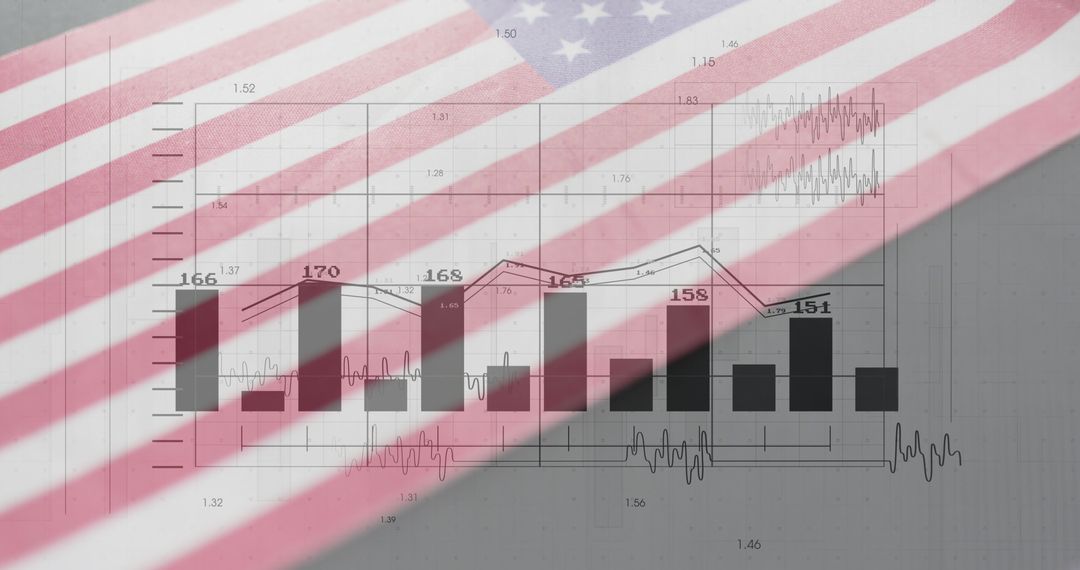
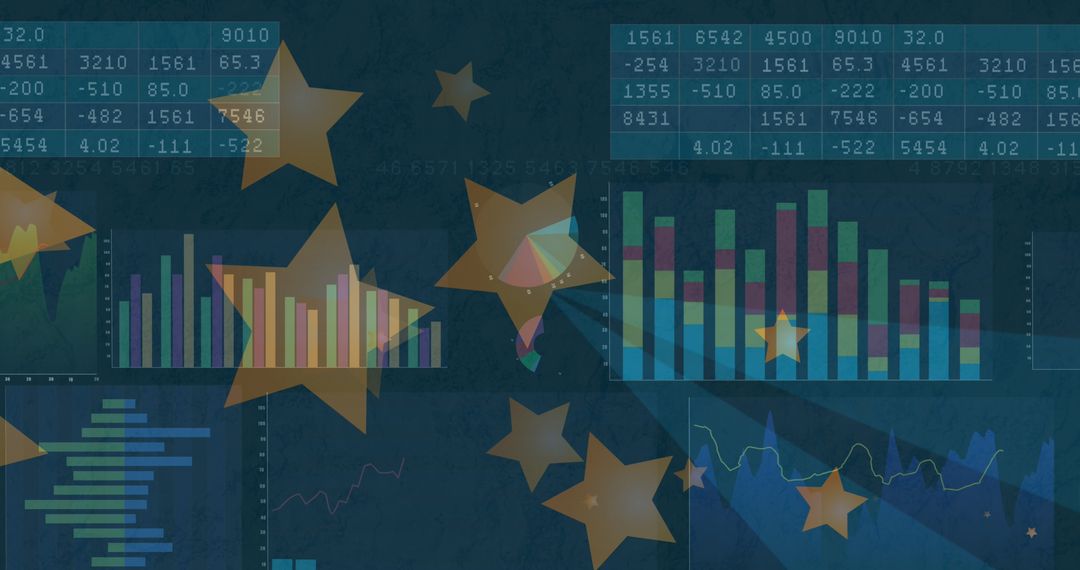
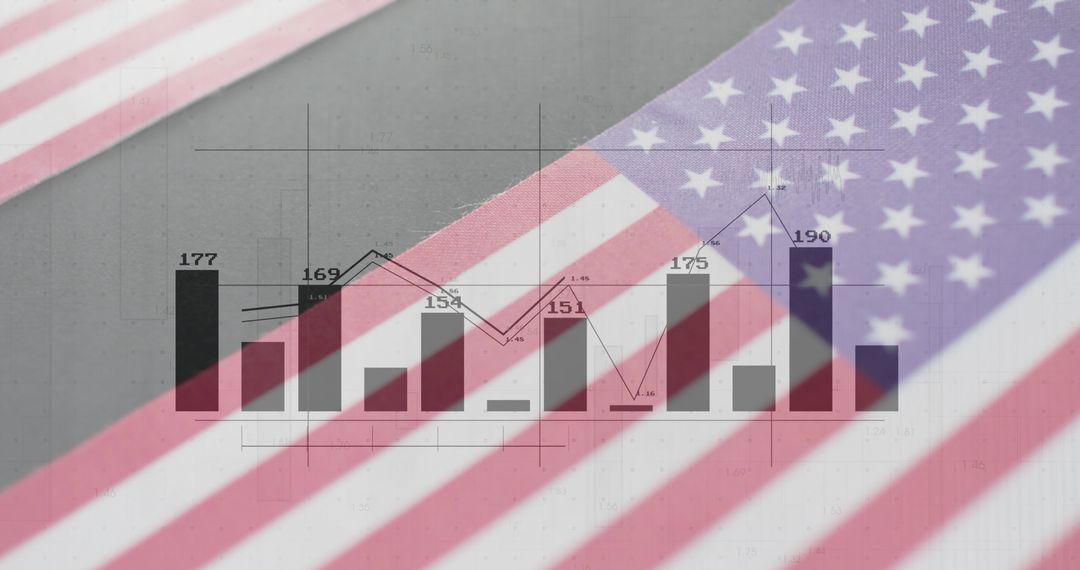
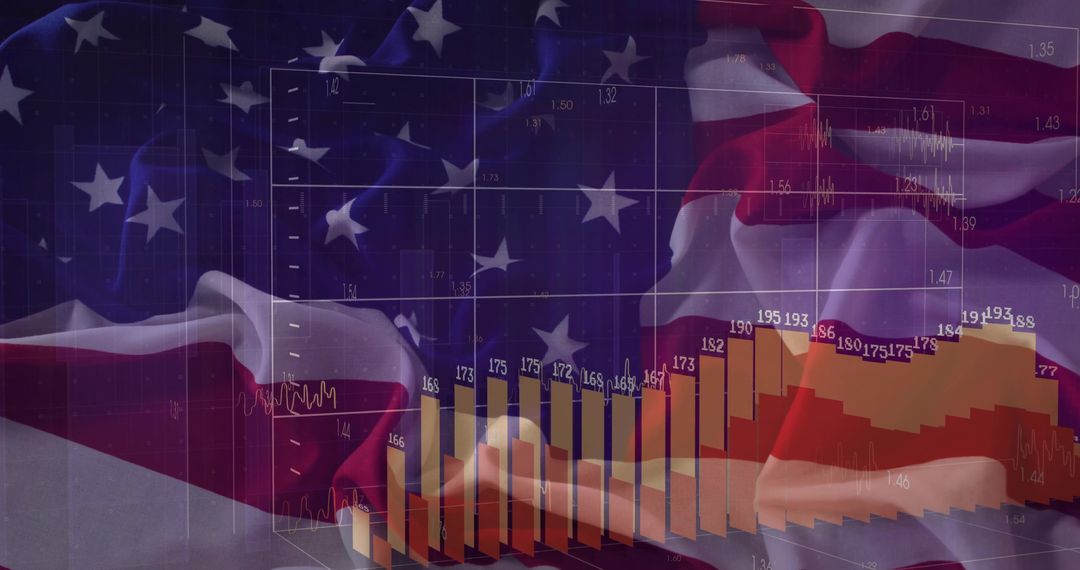
- US Stock Market Data Analysis with Candlestick Chart Overlay
US Stock Market Data Analysis with Candlestick Chart Overlay Image

Image showcases merging of digital financial tools with iconic US imagery. Candlestick chart signifies tracking market trends against background reminding of American flag. Resourceful for articles on American finance industry, international investments, and financial trends influenced by the US economy.
Powered by 


0
downloads
downloads
Tags:
More
Credit Photo
If you would like to credit the Photo, here are some ways you can do so
Text Link
photo Link
<span class="text-link">
<span>
<a target="_blank" href=https://pikwizard.com/photo/us-stock-market-data-analysis-with-candlestick-chart-overlay/19e4da7b0a1e534de11d85f6cd52f3ac/>PikWizard</a>
</span>
</span>
<span class="image-link">
<span
style="margin: 0 0 20px 0; display: inline-block; vertical-align: middle; width: 100%;"
>
<a
target="_blank"
href="https://pikwizard.com/photo/us-stock-market-data-analysis-with-candlestick-chart-overlay/19e4da7b0a1e534de11d85f6cd52f3ac/"
style="text-decoration: none; font-size: 10px; margin: 0;"
>
<img src="https://pikwizard.com/pw/medium/19e4da7b0a1e534de11d85f6cd52f3ac.jpg" style="margin: 0; width: 100%;" alt="" />
<p style="font-size: 12px; margin: 0;">PikWizard</p>
</a>
</span>
</span>
Free (free of charge)
Free for personal and commercial use.
Author: Creative Art
Similar Free Stock Images
Premium


Premium


Premium


Premium


Premium


Premium


Premium


Premium


Premium


Premium


Premium


Premium


Premium


Premium


Premium


Premium


Premium


Premium


Premium


Premium


Premium


Premium


Premium


Premium