
- Home >
- Stock Photos >
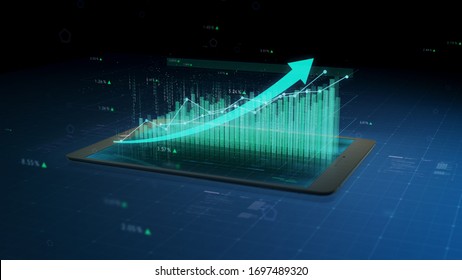
- Vibrant 3D Financial Graphs for Stock Market Analysis and Trading
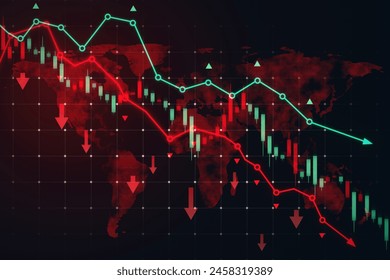
Vibrant 3D Financial Graphs for Stock Market Analysis and Trading Image

Dynamic 3D visualization of financial data showcases fluctuating stock market trends. Ideal for use in presentations, articles, websites, or educational materials about finance, investments, and economic analysis. Vibrant colors highlight key data points and boost engagement in analytical reports and financial tools.
Powered by  - Get 15% off with code: PIKWIZARD15


2
downloads
downloads
Tags:
More
Credit Photo
If you would like to credit the Photo, here are some ways you can do so
Text Link
photo Link
<span class="text-link">
<span>
<a target="_blank" href=https://pikwizard.com/photo/vibrant-3d-financial-graphs-for-stock-market-analysis-and-trading/db656d9faaa838daabeeb9e4e34a0cbe/>PikWizard</a>
</span>
</span>
<span class="image-link">
<span
style="margin: 0 0 20px 0; display: inline-block; vertical-align: middle; width: 100%;"
>
<a
target="_blank"
href="https://pikwizard.com/photo/vibrant-3d-financial-graphs-for-stock-market-analysis-and-trading/db656d9faaa838daabeeb9e4e34a0cbe/"
style="text-decoration: none; font-size: 10px; margin: 0;"
>
<img src="https://pikwizard.com/pw/medium/db656d9faaa838daabeeb9e4e34a0cbe.jpg" style="margin: 0; width: 100%;" alt="" />
<p style="font-size: 12px; margin: 0;">PikWizard</p>
</a>
</span>
</span>
Free (free of charge)
Free for personal and commercial use.
Author: Authentic Images
Similar Free Stock Images
Loading...

Premium


Premium


Premium


Premium


Premium
Premium

Premium


Premium


Premium

Premium
Premium


Premium


Premium


Premium


Premium

Premium

Premium


Premium


Premium

Premium


Premium


Premium


Premium


Premium

Premium
