- Home >
- Stock Photos >
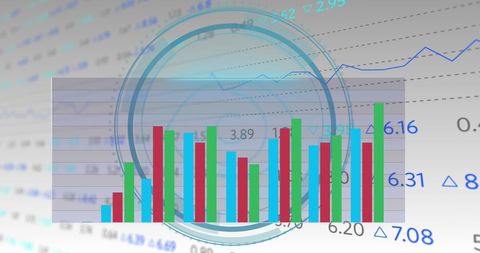
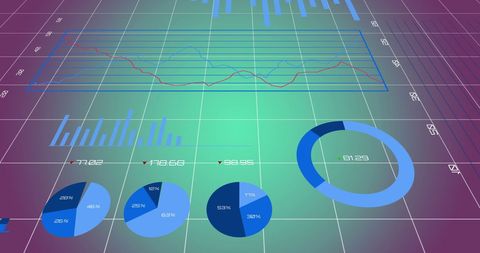
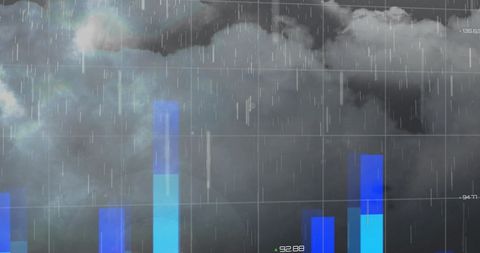
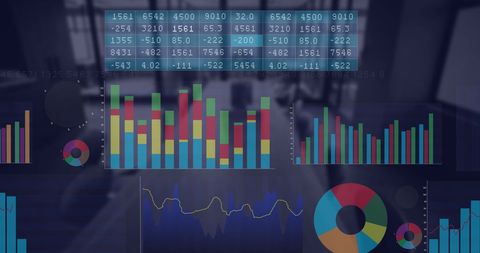
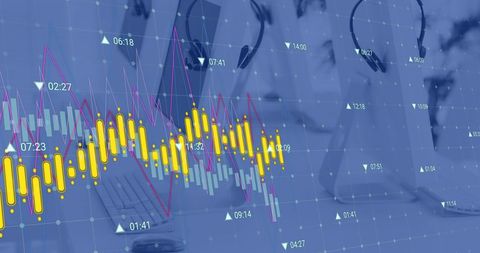
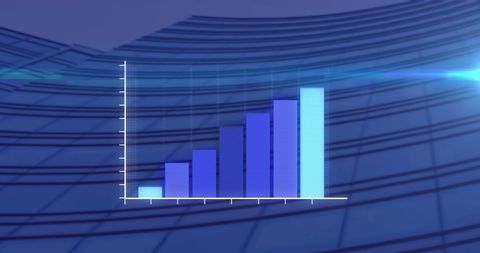
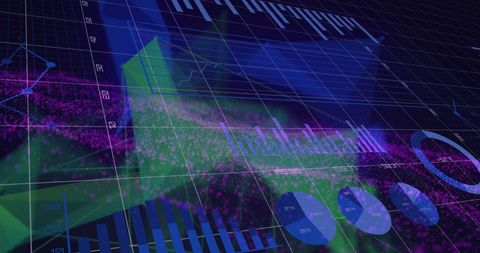
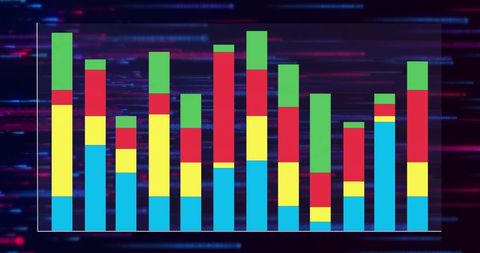
- Vibrant Bar Graph and Digital Data Analysis Interface
Vibrant Bar Graph and Digital Data Analysis Interface Image

Vibrant bar graph overlaying digitally enhanced data processing charts, representing modern technology in communication and business analytics. Useful for presenting financial reports, illustrating digital interfaces in presentations, and showcasing advanced communication tools for data interpretation.

downloads
Tags:
More
Credit Photo
If you would like to credit the Photo, here are some ways you can do so
Text Link
photo Link
<span class="text-link">
<span>
<a target="_blank" href=https://pikwizard.com/photo/vibrant-bar-graph-and-digital-data-analysis-interface/16aadb23874ea381cb69ff3c770fbd2d/>PikWizard</a>
</span>
</span>
<span class="image-link">
<span
style="margin: 0 0 20px 0; display: inline-block; vertical-align: middle; width: 100%;"
>
<a
target="_blank"
href="https://pikwizard.com/photo/vibrant-bar-graph-and-digital-data-analysis-interface/16aadb23874ea381cb69ff3c770fbd2d/"
style="text-decoration: none; font-size: 10px; margin: 0;"
>
<img src="https://pikwizard.com/pw/medium/16aadb23874ea381cb69ff3c770fbd2d.jpg" style="margin: 0; width: 100%;" alt="" />
<p style="font-size: 12px; margin: 0;">PikWizard</p>
</a>
</span>
</span>
Free (free of charge)
Free for personal and commercial use.
Author: Awesome Content