- Home >
- Stock Photos >
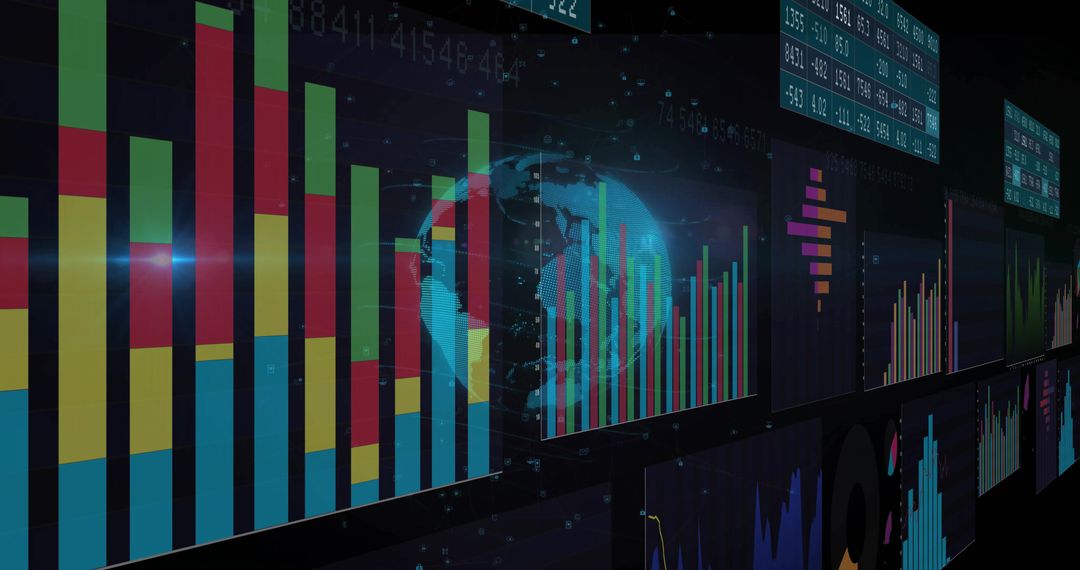
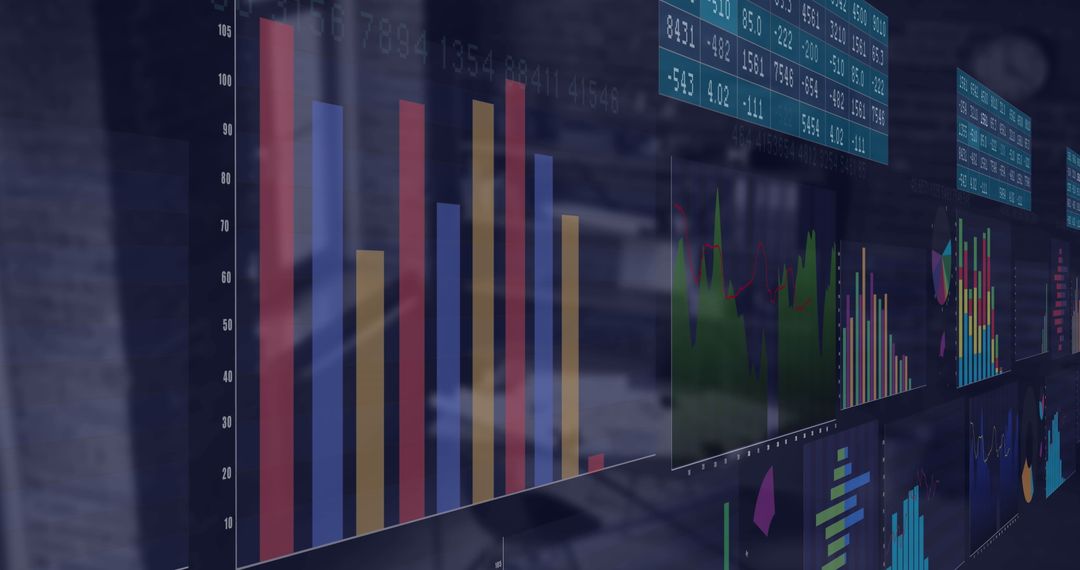
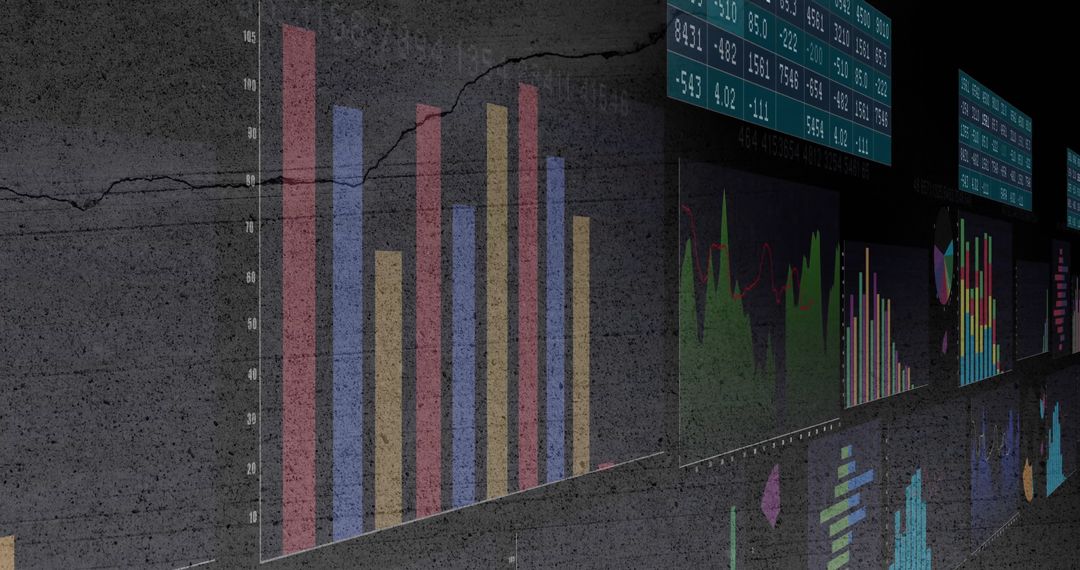
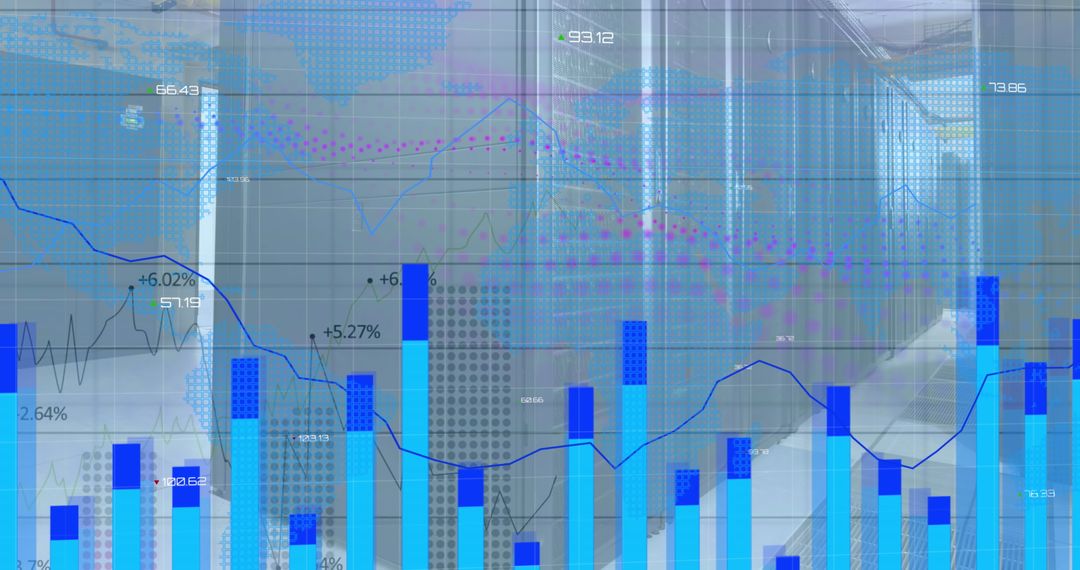
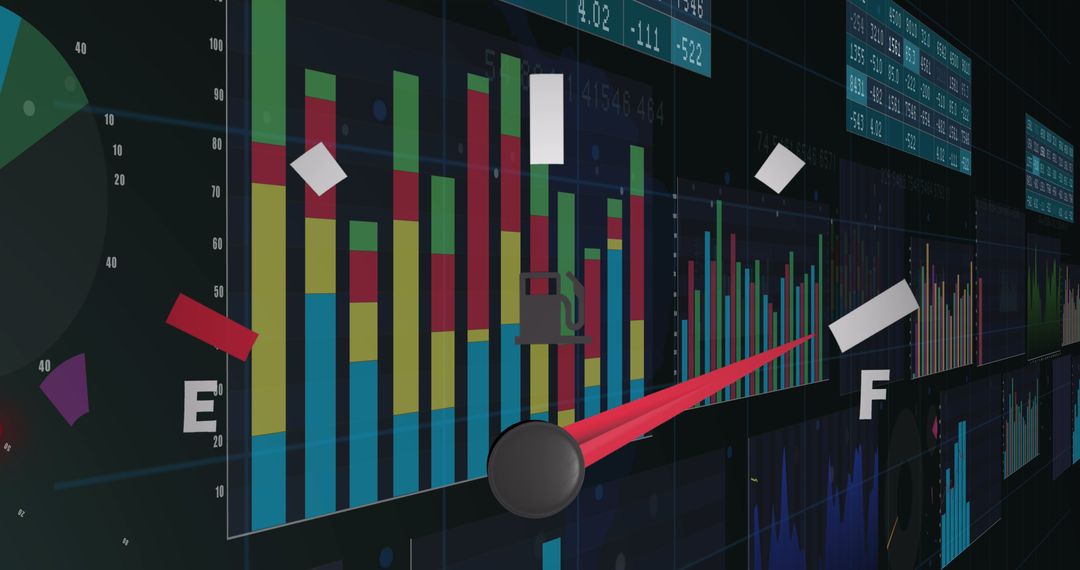
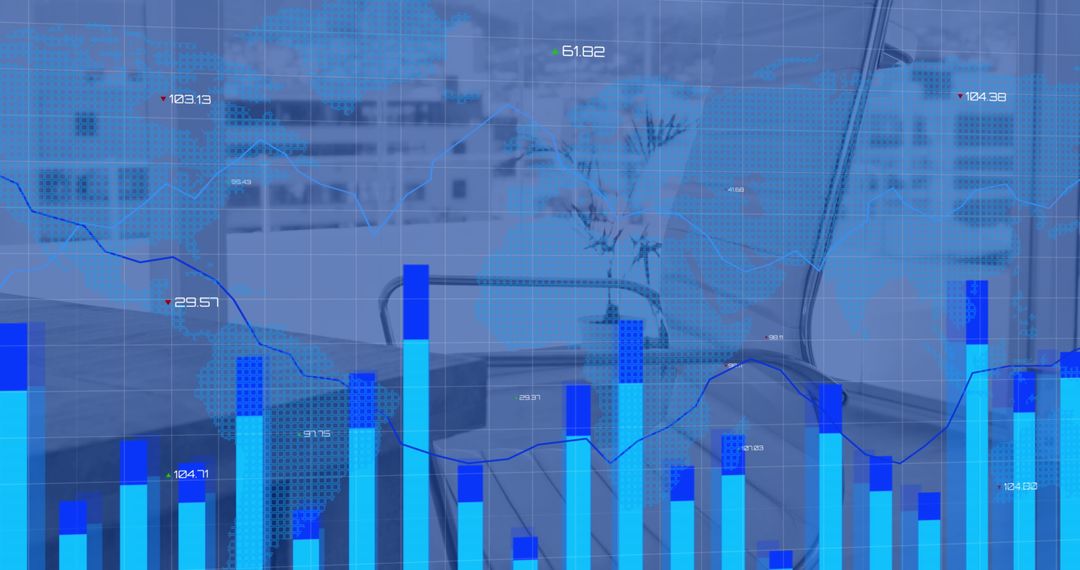
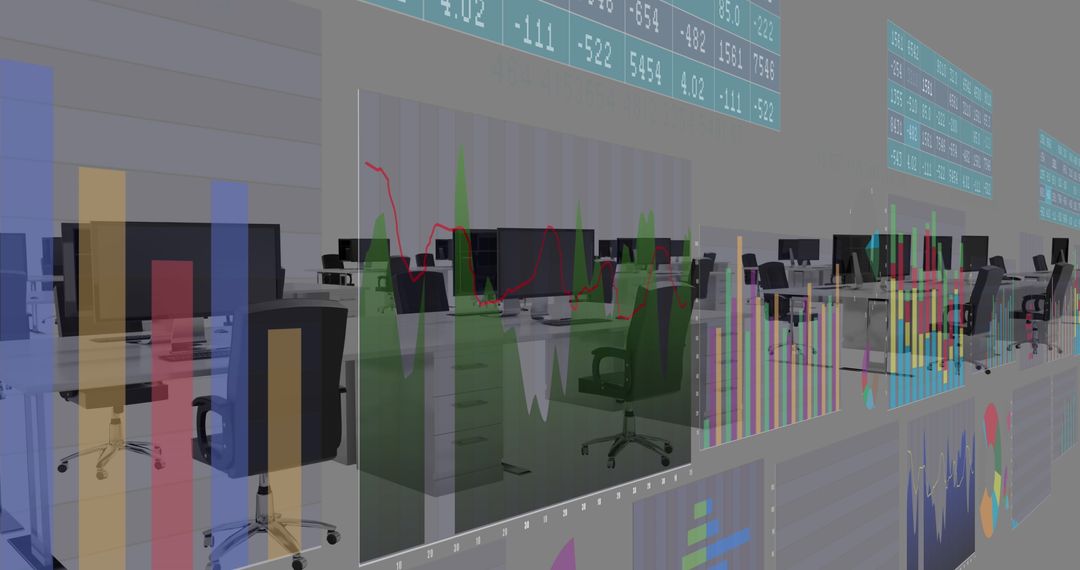
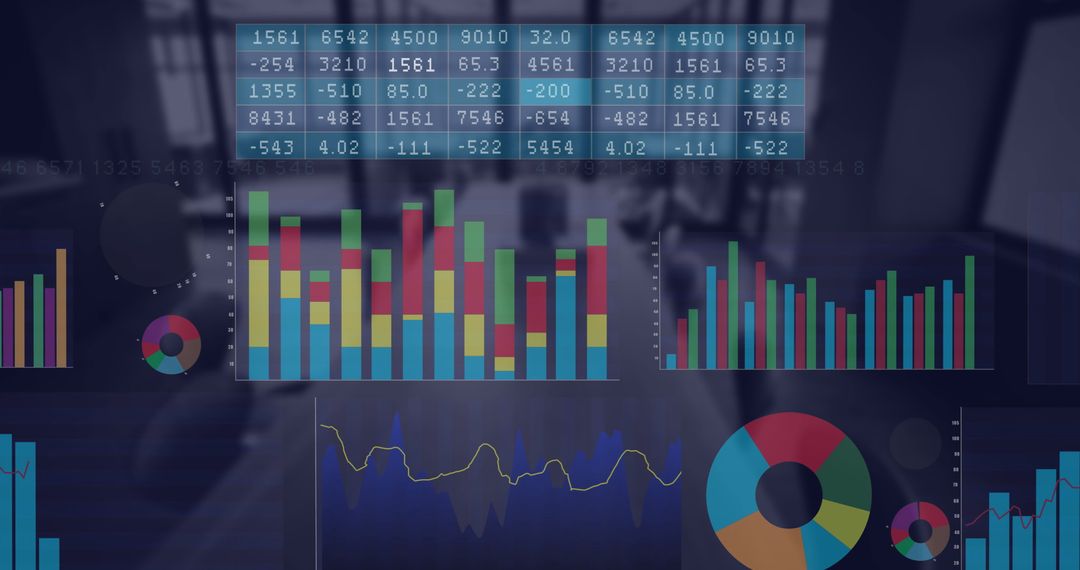
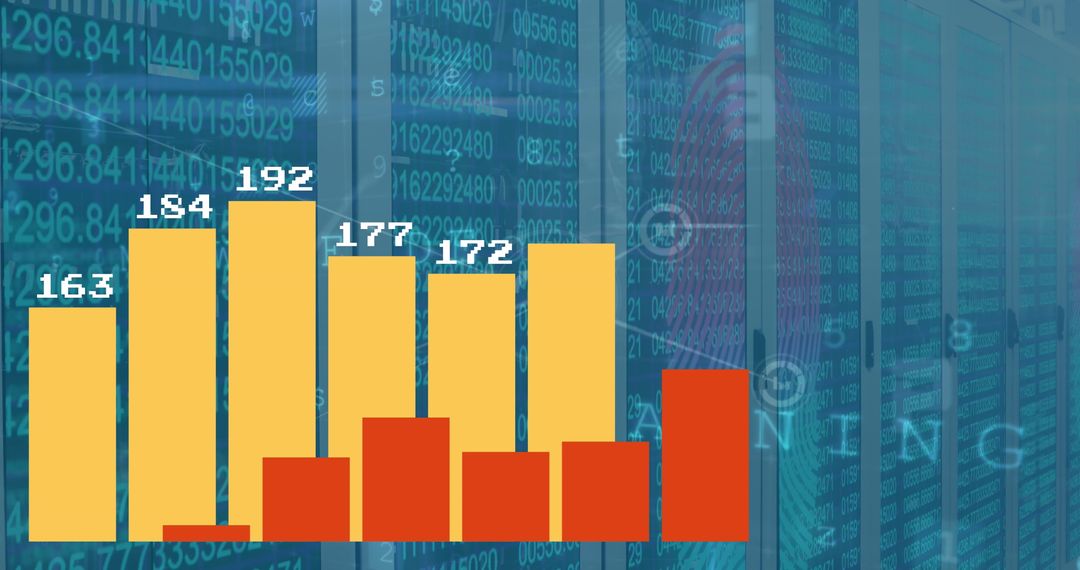
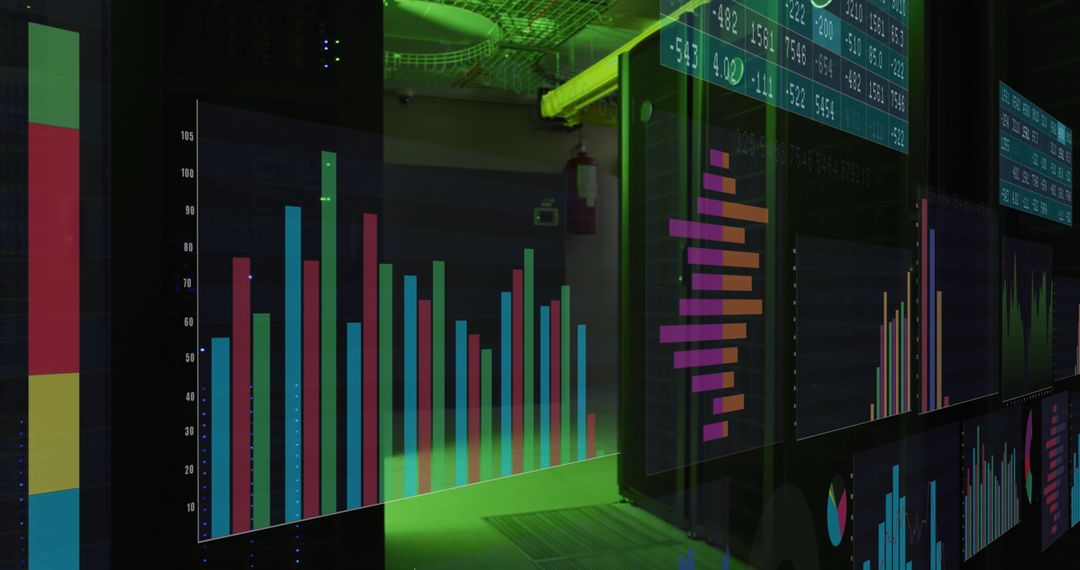
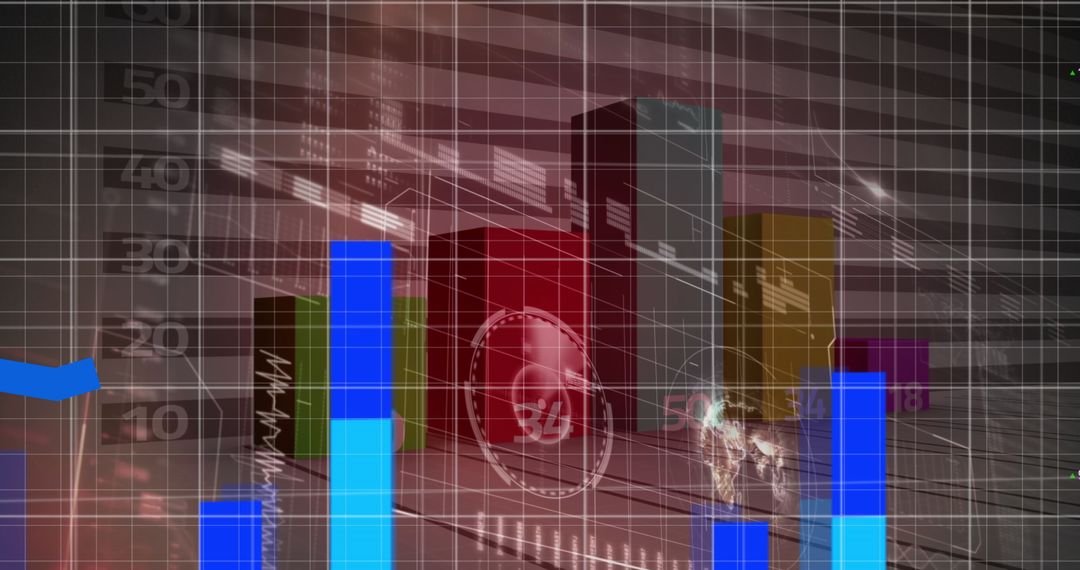
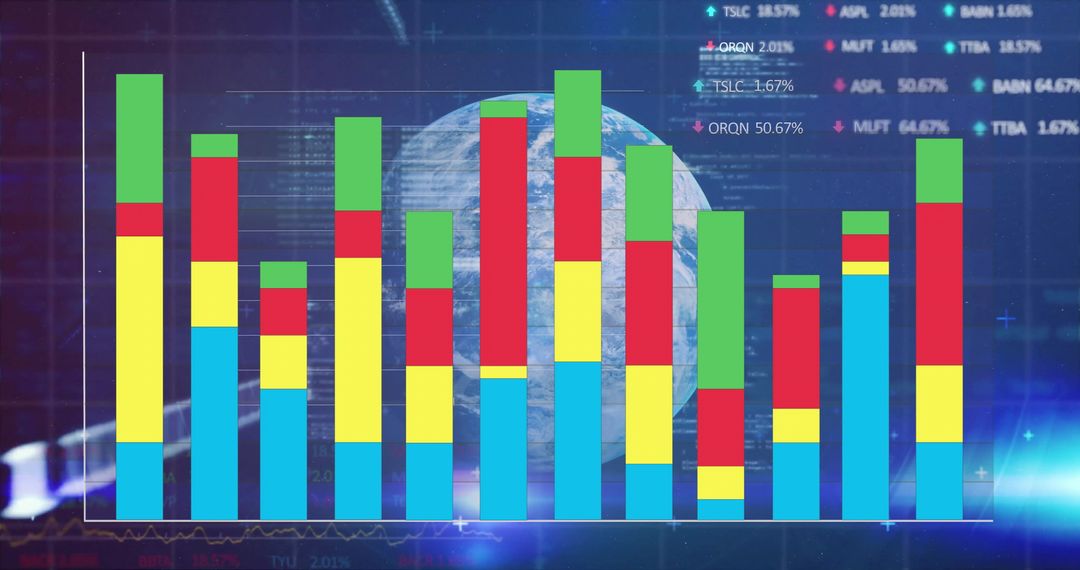
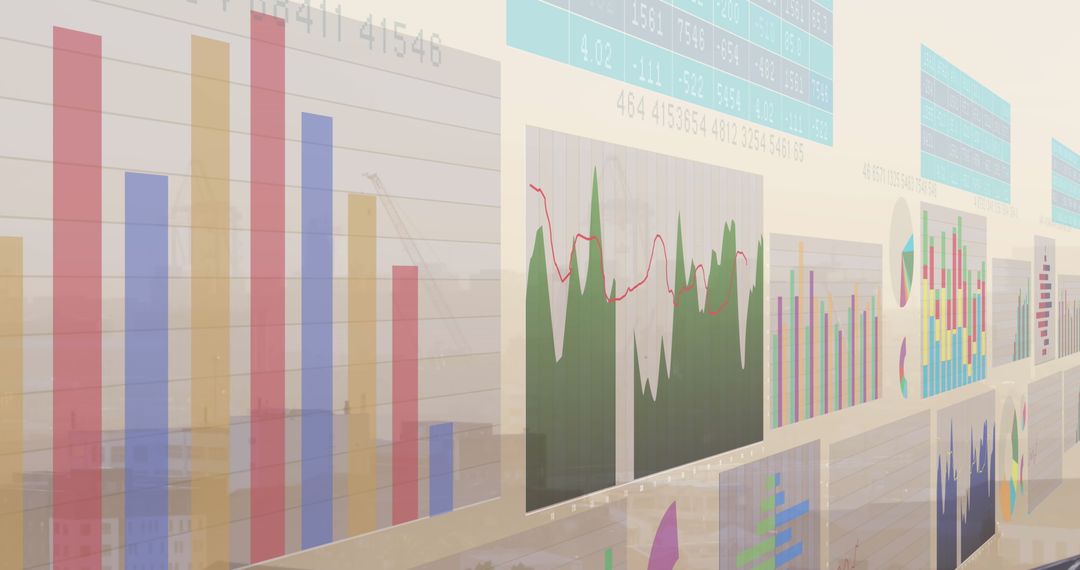
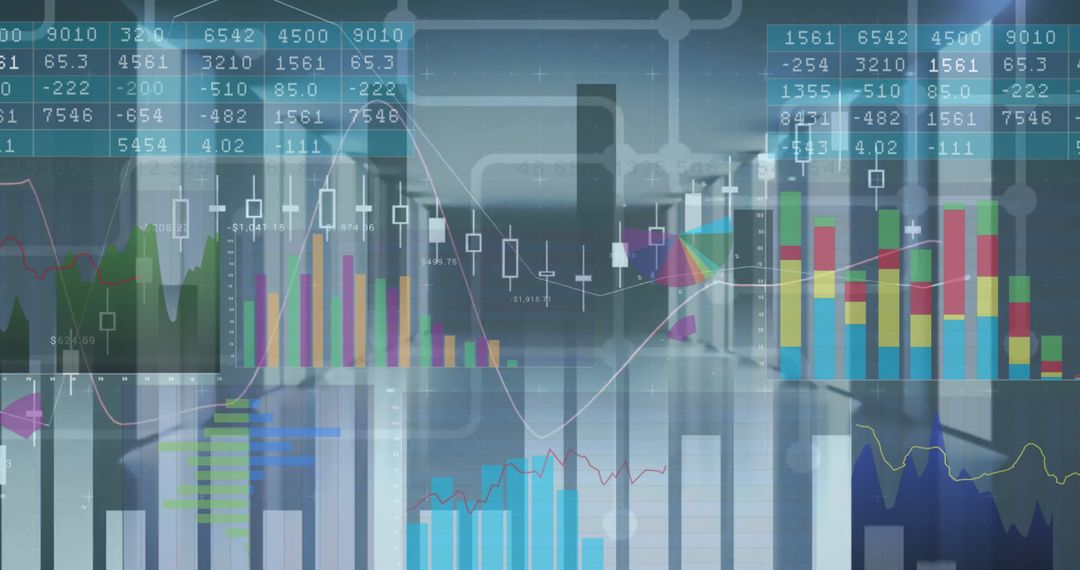
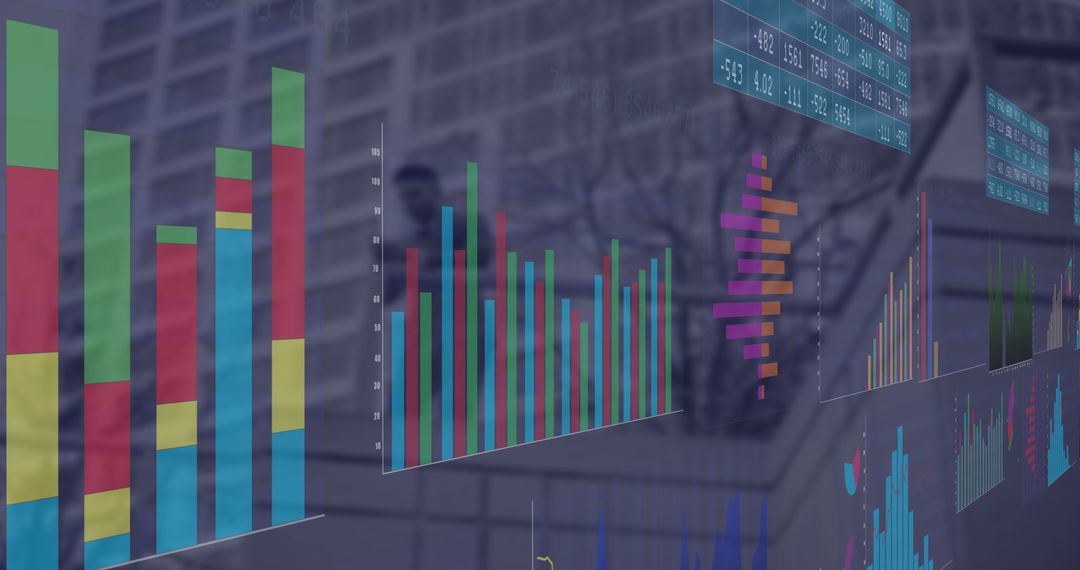
- Vibrant Data Charts and Graphs on Office Glass Panel
Vibrant Data Charts and Graphs on Office Glass Panel Image

Complex data charts and graphs overlayed on an office setting. Vibrant colors and diverse symbols illustrate a sophisticated technological environment. Prime for use in presentations or marketing materials focused on data analysis, business intelligence, or digital innovation.
Powered by  - Get 15% off with code: PIKWIZARD15


2
downloads
downloads
Tags:
More
Credit Photo
If you would like to credit the Photo, here are some ways you can do so
Text Link
photo Link
<span class="text-link">
<span>
<a target="_blank" href=https://pikwizard.com/photo/vibrant-data-charts-and-graphs-on-office-glass-panel/03fe0d661a3ce6df30eebd88e5211acb/>PikWizard</a>
</span>
</span>
<span class="image-link">
<span
style="margin: 0 0 20px 0; display: inline-block; vertical-align: middle; width: 100%;"
>
<a
target="_blank"
href="https://pikwizard.com/photo/vibrant-data-charts-and-graphs-on-office-glass-panel/03fe0d661a3ce6df30eebd88e5211acb/"
style="text-decoration: none; font-size: 10px; margin: 0;"
>
<img src="https://pikwizard.com/pw/medium/03fe0d661a3ce6df30eebd88e5211acb.jpg" style="margin: 0; width: 100%;" alt="" />
<p style="font-size: 12px; margin: 0;">PikWizard</p>
</a>
</span>
</span>
Free (free of charge)
Free for personal and commercial use.
Author: Creative Art
Similar Free Stock Images

Premium


Premium


Premium


Premium


Premium


Premium


Premium


Premium


Premium


Premium


Premium


Premium


Premium


Premium


Premium


Premium


Premium


Premium


Premium


Premium


Premium

Premium


Premium

Premium