
- Home >
- Stock Photos >
- Vibrant Data Visualization Overlay on Scenic Lakeside Valley
Vibrant Data Visualization Overlay on Scenic Lakeside Valley Image
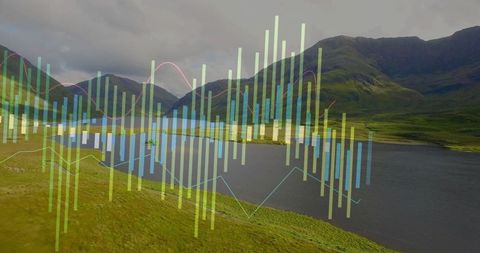
This mathematical overlay of graphs and charts superimposed on a picturesque lakeside valley portrays an innovative blend of technology and nature, showcasing possible ecological analytics, environmental science presentations, or luxury travel data dynamics. Ideal for use in websites or projects focused on digital analytics in natural landscapes, illustrating data comprehension abilities or similar fields.
Powered by  - Get 15% off with code: PIKWIZARD15


downloads
Tags:
More
Credit Photo
If you would like to credit the Photo, here are some ways you can do so
Text Link
photo Link
<span class="text-link">
<span>
<a target="_blank" href=https://pikwizard.com/photo/vibrant-data-visualization-overlay-on-scenic-lakeside-valley/98e1f66554d02350819ca2e97bb85caa/>PikWizard</a>
</span>
</span>
<span class="image-link">
<span
style="margin: 0 0 20px 0; display: inline-block; vertical-align: middle; width: 100%;"
>
<a
target="_blank"
href="https://pikwizard.com/photo/vibrant-data-visualization-overlay-on-scenic-lakeside-valley/98e1f66554d02350819ca2e97bb85caa/"
style="text-decoration: none; font-size: 10px; margin: 0;"
>
<img src="https://pikwizard.com/pw/medium/98e1f66554d02350819ca2e97bb85caa.jpg" style="margin: 0; width: 100%;" alt="" />
<p style="font-size: 12px; margin: 0;">PikWizard</p>
</a>
</span>
</span>
Free (free of charge)
Free for personal and commercial use.
Author: People Creations