- Home >
- Stock Photos >
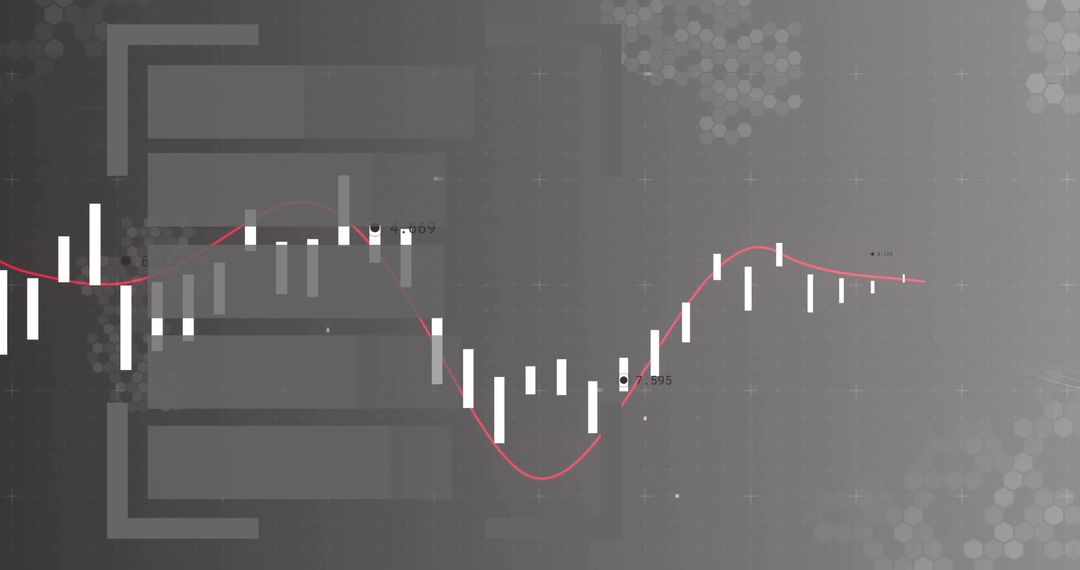
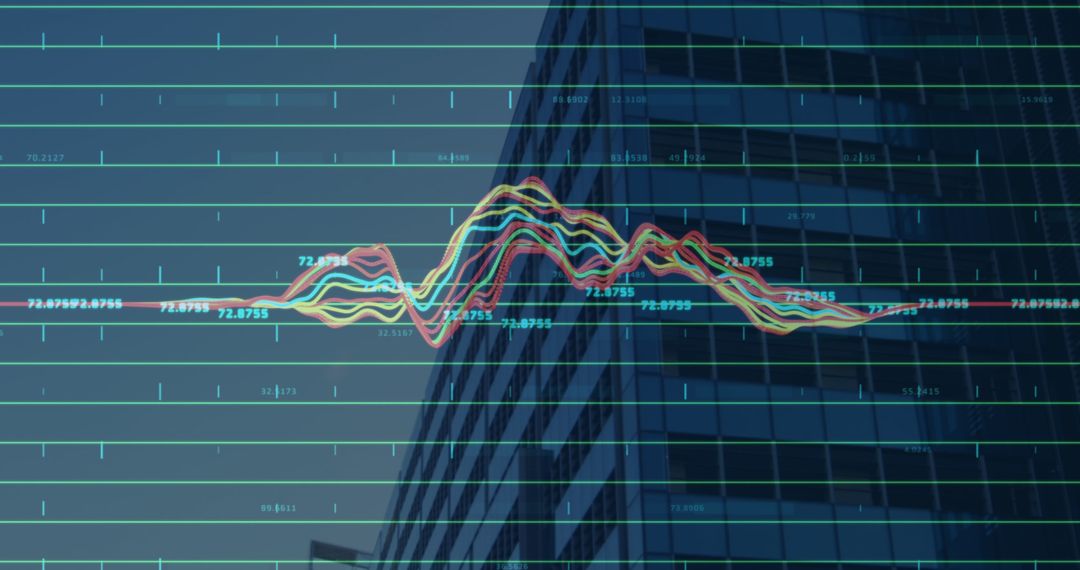
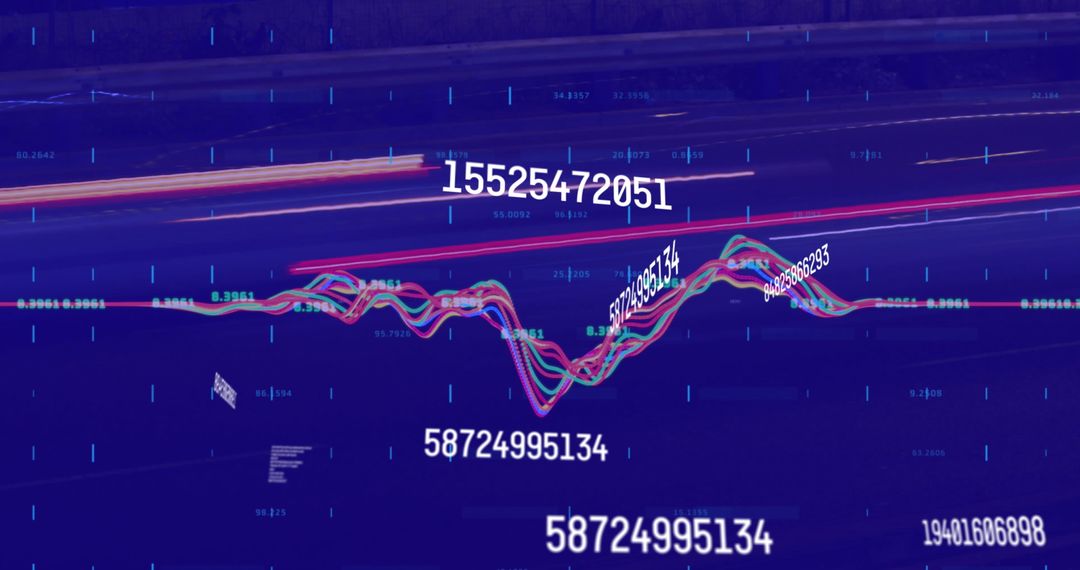
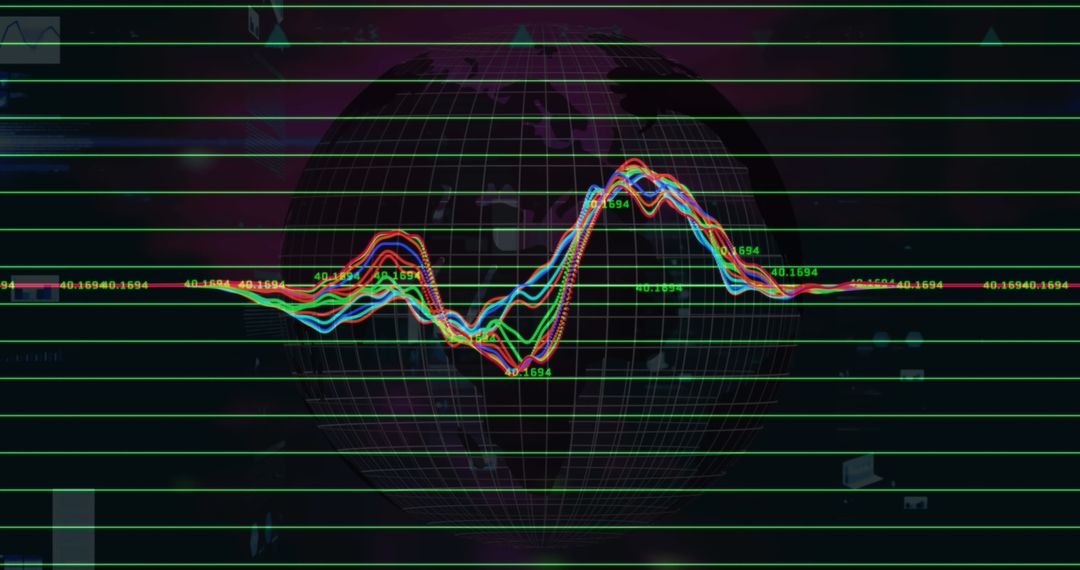
- Vibrant Data Visualization with Flowing Line Graphs and Shifting Numbers
Vibrant Data Visualization with Flowing Line Graphs and Shifting Numbers Image

Colorful lines form flowing line graphs with fluctuating numbers on abstract backdrop. Ideal for illustrating market trends, technological concepts, financial analytics, and business forecasting visuals. Represents dynamic changes in data, useful for presentation designs and educational materials focusing on data analysis or tech industries.
Powered by  - Get 15% off with code: PIKWIZARD15


2
downloads
downloads
Tags:
More
Credit Photo
If you would like to credit the Photo, here are some ways you can do so
Text Link
photo Link
<span class="text-link">
<span>
<a target="_blank" href=https://pikwizard.com/photo/vibrant-data-visualization-with-flowing-line-graphs-and-shifting-numbers/022715e288d58b44538dc334e2077549/>PikWizard</a>
</span>
</span>
<span class="image-link">
<span
style="margin: 0 0 20px 0; display: inline-block; vertical-align: middle; width: 100%;"
>
<a
target="_blank"
href="https://pikwizard.com/photo/vibrant-data-visualization-with-flowing-line-graphs-and-shifting-numbers/022715e288d58b44538dc334e2077549/"
style="text-decoration: none; font-size: 10px; margin: 0;"
>
<img src="https://pikwizard.com/pw/medium/022715e288d58b44538dc334e2077549.jpg" style="margin: 0; width: 100%;" alt="" />
<p style="font-size: 12px; margin: 0;">PikWizard</p>
</a>
</span>
</span>
Free (free of charge)
Free for personal and commercial use.
Author: Awesome Content
Similar Free Stock Images

Premium


Premium


Premium


Premium


Premium


Premium


Premium


Premium


Premium


Premium


Premium


Premium


Premium


Premium


Premium


Premium


Premium


Premium


Premium


Premium


Premium


Premium


Premium


Premium