- Home >
- Stock Photos >
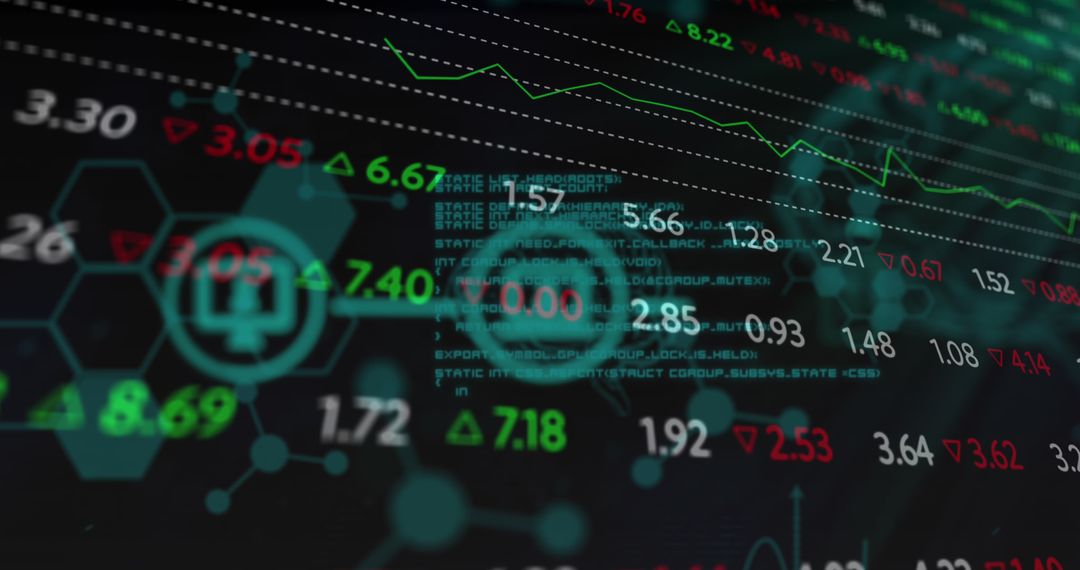
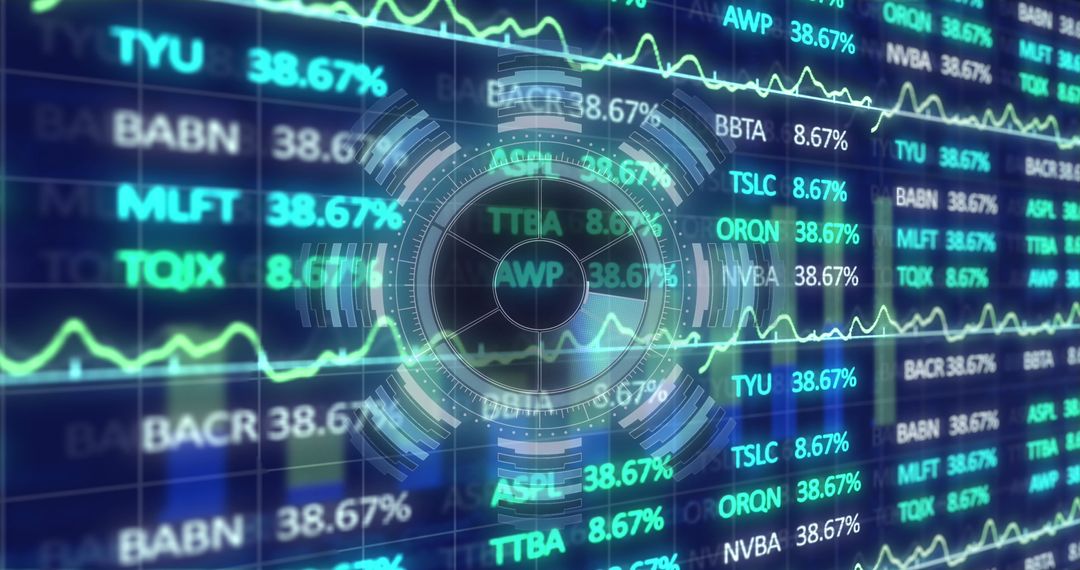
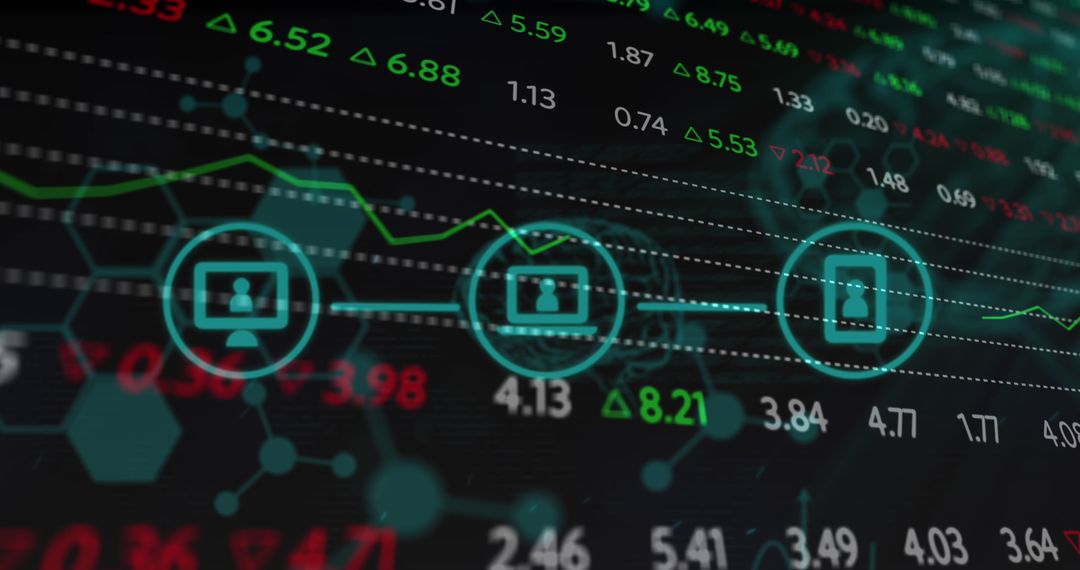
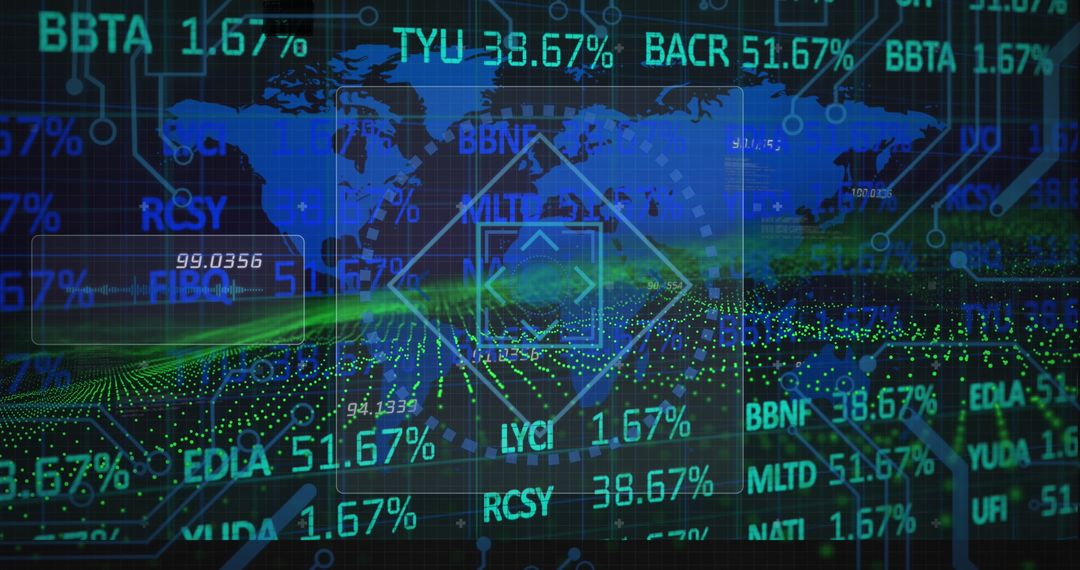
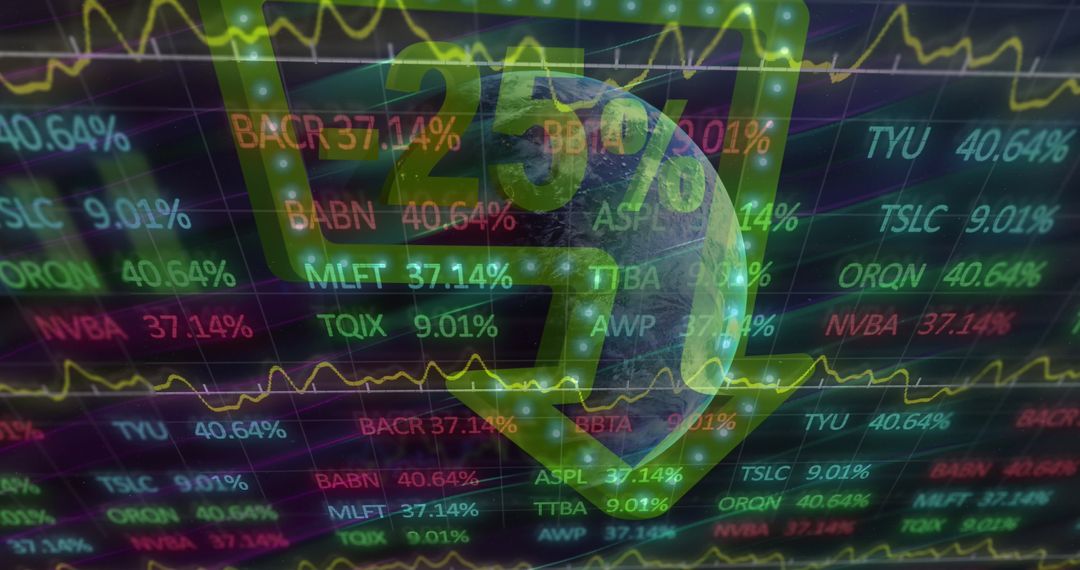
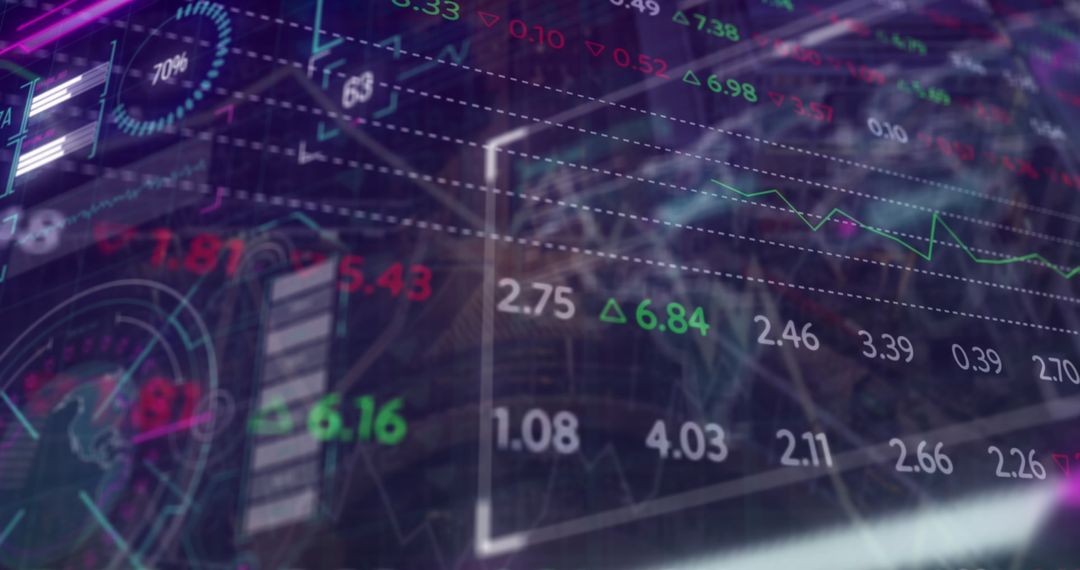
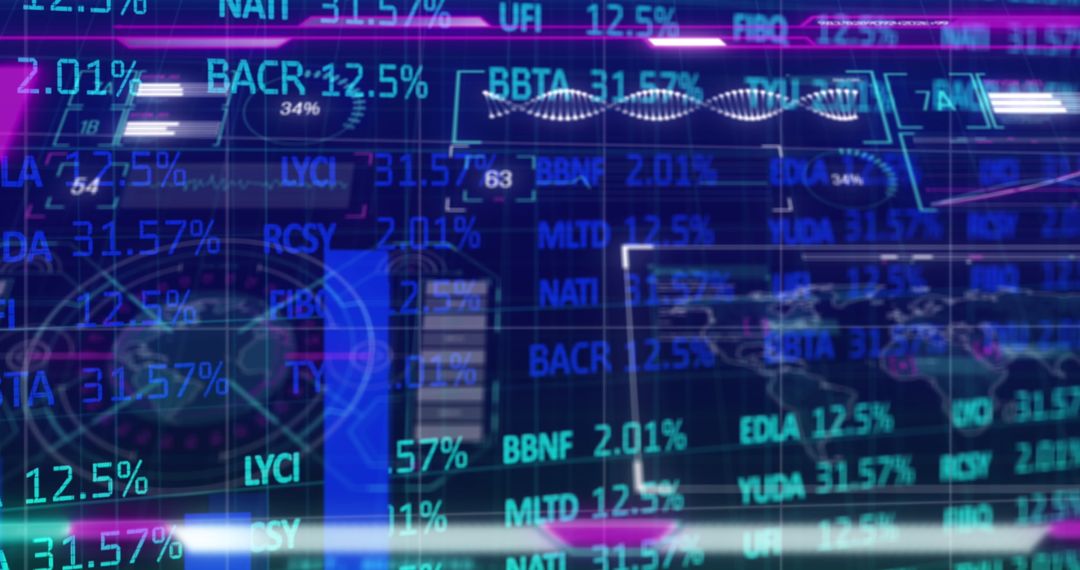
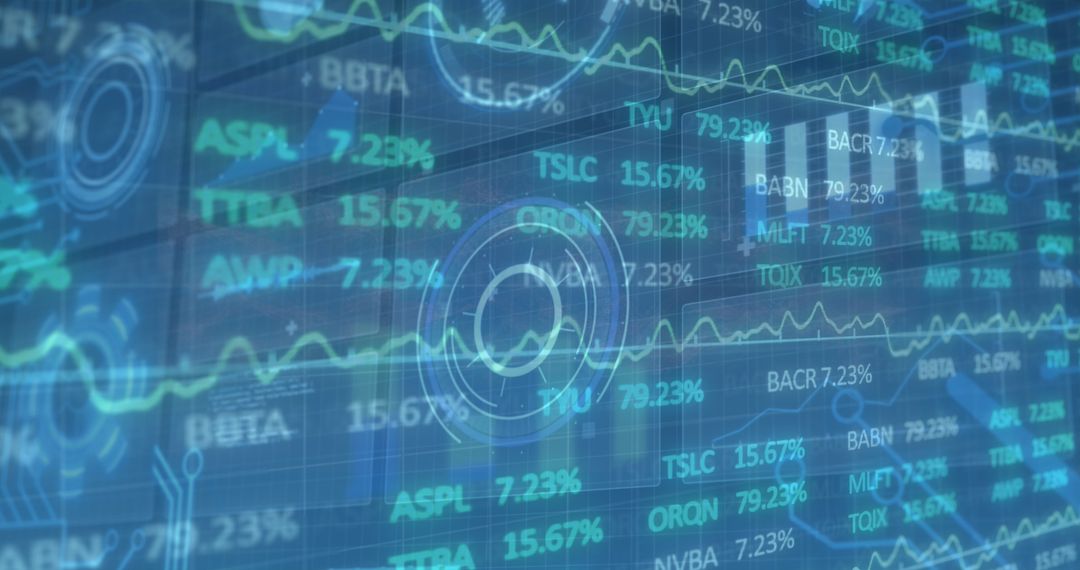
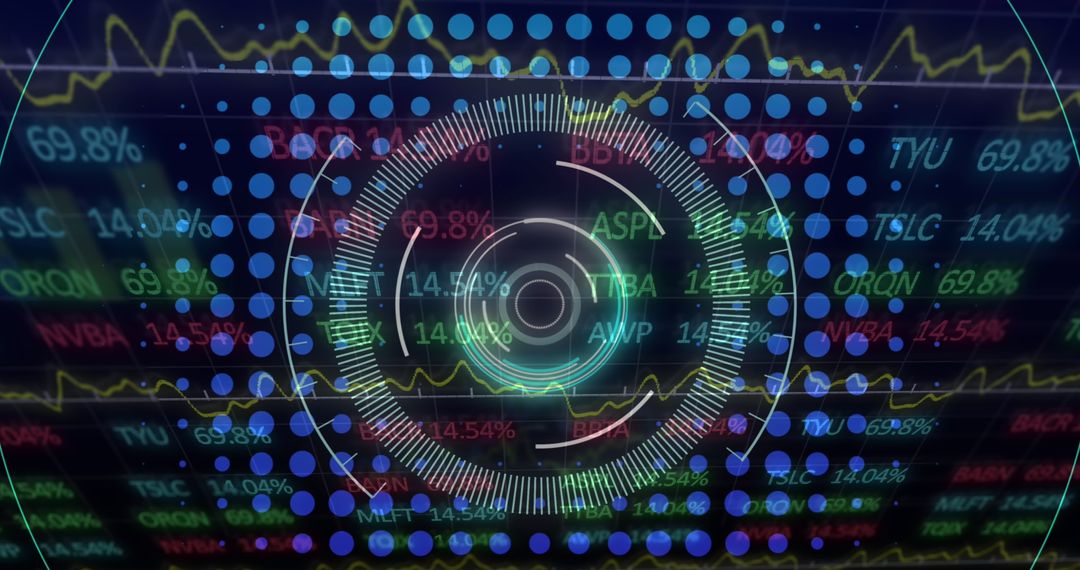
- Vibrant Digital Financial Data Interface with Graphs and Numbers
Vibrant Digital Financial Data Interface with Graphs and Numbers Image
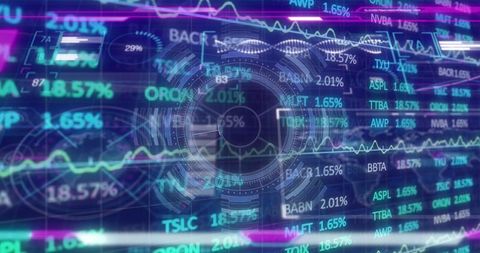
This visual of a digital screen displaying financial data, graphs, and figures represents global finance interactions and economic trends. It is ideal for illustrating stock market analyses, economic studies, and data science innovations. Widely useful for financial publications, technology-themed articles, or modern business presentations emphasizing technological advancements in economic sectors.
Powered by 


2
downloads
downloads
Tags:
More
Credit Photo
If you would like to credit the Photo, here are some ways you can do so
Text Link
photo Link
<span class="text-link">
<span>
<a target="_blank" href=https://pikwizard.com/photo/vibrant-digital-financial-data-interface-with-graphs-and-numbers/f1d7d122d6c62932b71669860f5642a8/>PikWizard</a>
</span>
</span>
<span class="image-link">
<span
style="margin: 0 0 20px 0; display: inline-block; vertical-align: middle; width: 100%;"
>
<a
target="_blank"
href="https://pikwizard.com/photo/vibrant-digital-financial-data-interface-with-graphs-and-numbers/f1d7d122d6c62932b71669860f5642a8/"
style="text-decoration: none; font-size: 10px; margin: 0;"
>
<img src="https://pikwizard.com/pw/medium/f1d7d122d6c62932b71669860f5642a8.jpg" style="margin: 0; width: 100%;" alt="" />
<p style="font-size: 12px; margin: 0;">PikWizard</p>
</a>
</span>
</span>
Free (free of charge)
Free for personal and commercial use.
Author: Creative Art
Similar Free Stock Images

Premium


Premium


Premium


Premium


Premium


Premium


Premium


Premium


Premium


Premium


Premium


Premium


Premium


Premium


Premium


Premium


Premium

Premium


Premium


Premium


Premium


Premium


Premium


Premium