- Home >
- Stock Photos >
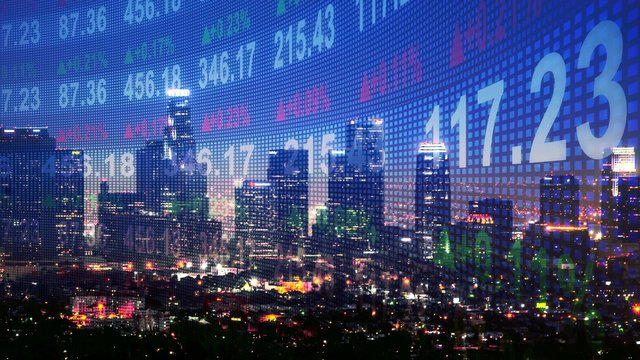
- Vibrant Digital Stock Market Graph Showing Financial Data Trends
Vibrant Digital Stock Market Graph Showing Financial Data Trends Image

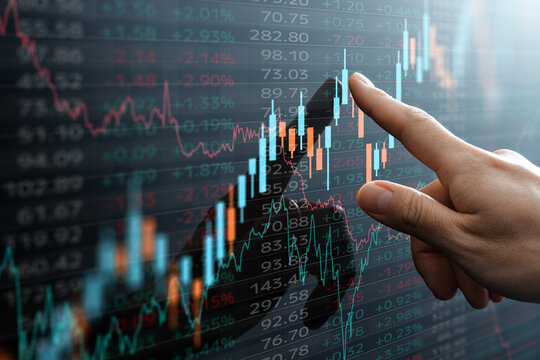
AI Generated Image. Illustrating a vibrant and dynamic representation of stock market trends, this visual effectively conveys the energy and fast-paced environment of financial trading. The digital patterns can be used in presentations, websites, and reports related to finance, investment analysis, or market strategies. Ideal for portraying themes of innovation and technological advancement in the global financial arena.
Powered by 


3
downloads
downloads
Tags:
More
Credit Photo
If you would like to credit the Photo, here are some ways you can do so
Text Link
photo Link
<span class="text-link">
<span>
<a target="_blank" href=https://pikwizard.com/photo/vibrant-digital-stock-market-graph-showing-financial-data-trends/751fba617c2a8b3c75681497d69df5b3/>PikWizard</a>
</span>
</span>
<span class="image-link">
<span
style="margin: 0 0 20px 0; display: inline-block; vertical-align: middle; width: 100%;"
>
<a
target="_blank"
href="https://pikwizard.com/photo/vibrant-digital-stock-market-graph-showing-financial-data-trends/751fba617c2a8b3c75681497d69df5b3/"
style="text-decoration: none; font-size: 10px; margin: 0;"
>
<img src="https://pikwizard.com/pw/medium/751fba617c2a8b3c75681497d69df5b3.jpg" style="margin: 0; width: 100%;" alt="" />
<p style="font-size: 12px; margin: 0;">PikWizard</p>
</a>
</span>
</span>
Free (free of charge)
Free for personal and commercial use.
Author: AI Creator
Similar Free Stock Images

Premium


Premium


Premium


Premium


Premium


Premium


Premium


Premium


Premium


Premium


Premium


Premium


Premium


Premium


Premium


Premium


Premium


Premium


Premium


Premium


Premium


Premium


Premium


Premium