
- Home >
- Stock Photos >
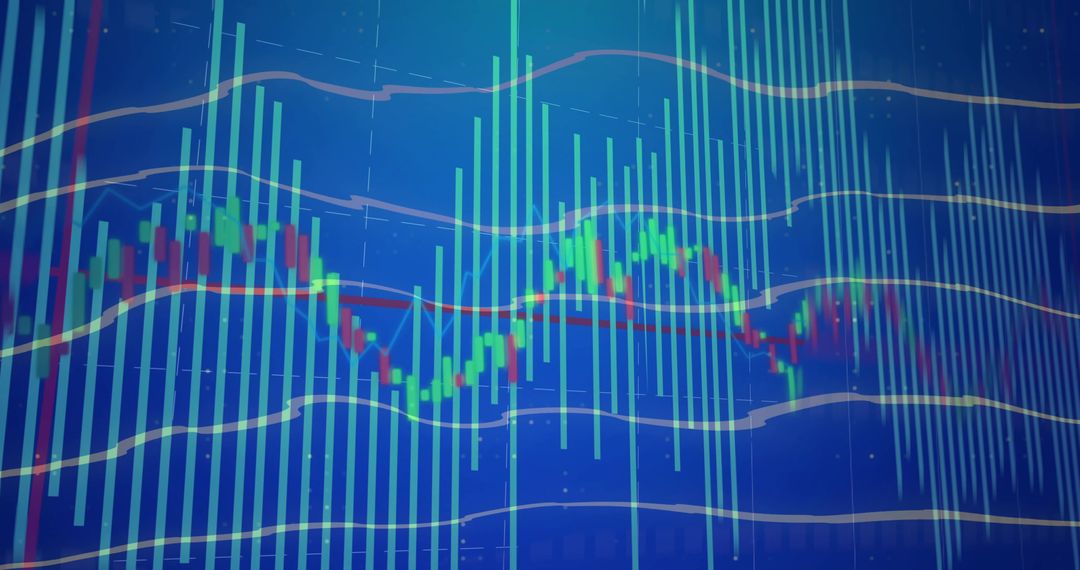
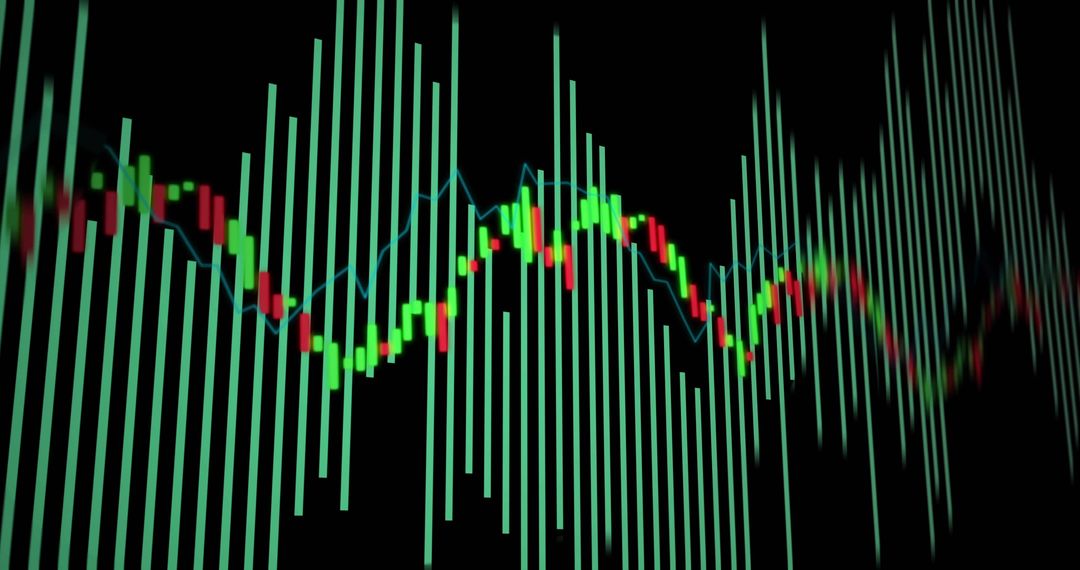
- Vibrant Financial Candlestick Chart with Trend Lines
Vibrant Financial Candlestick Chart with Trend Lines Image

Multicolored financial candlestick chart with trend lines illustrating stock market performance. It visualizes financial data and market analytics with vibrant colors. Suitable for articles or presentations on economic analysis, trading strategies, and financial technology.
Powered by  - Get 15% off with code: PIKWIZARD15


0
downloads
downloads
Tags:
More
Credit Photo
If you would like to credit the Photo, here are some ways you can do so
Text Link
photo Link
<span class="text-link">
<span>
<a target="_blank" href=https://pikwizard.com/photo/vibrant-financial-candlestick-chart-with-trend-lines/7d57b08b4955e4441b22de2881fca595/>PikWizard</a>
</span>
</span>
<span class="image-link">
<span
style="margin: 0 0 20px 0; display: inline-block; vertical-align: middle; width: 100%;"
>
<a
target="_blank"
href="https://pikwizard.com/photo/vibrant-financial-candlestick-chart-with-trend-lines/7d57b08b4955e4441b22de2881fca595/"
style="text-decoration: none; font-size: 10px; margin: 0;"
>
<img src="https://pikwizard.com/pw/medium/7d57b08b4955e4441b22de2881fca595.jpg" style="margin: 0; width: 100%;" alt="" />
<p style="font-size: 12px; margin: 0;">PikWizard</p>
</a>
</span>
</span>
Free (free of charge)
Free for personal and commercial use.
Author: Authentic Images
Similar Free Stock Images

Premium


Premium


Premium


Premium


Premium


Premium


Premium


Premium


Premium


Premium


Premium


Premium


Premium


Premium


Premium


Premium


Premium


Premium


Premium


Premium


Premium


Premium


Premium


Premium

