- Home >
- Stock Photos >
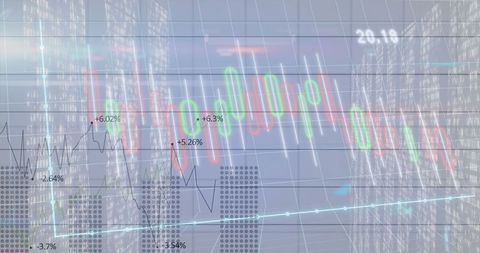
- Vibrant Financial Chart Overlay on Trading Dashboard
Vibrant Financial Chart Overlay on Trading Dashboard Image

Visualization displaying digital financial data overlay. Ideal for finance-oriented businesses, presentations about market trends, or educational materials that focus on trading analytics. Purple hues and colorful elements enhance modern financial technology themes. Useful in reports, articles, or interfaces highlighting data-driven strategies.
Powered by 


downloads
Tags:
More
Credit Photo
If you would like to credit the Photo, here are some ways you can do so
Text Link
photo Link
<span class="text-link">
<span>
<a target="_blank" href=https://pikwizard.com/photo/vibrant-financial-chart-overlay-on-trading-dashboard/172b17093202a29b763a96e3964aa95a/>PikWizard</a>
</span>
</span>
<span class="image-link">
<span
style="margin: 0 0 20px 0; display: inline-block; vertical-align: middle; width: 100%;"
>
<a
target="_blank"
href="https://pikwizard.com/photo/vibrant-financial-chart-overlay-on-trading-dashboard/172b17093202a29b763a96e3964aa95a/"
style="text-decoration: none; font-size: 10px; margin: 0;"
>
<img src="https://pikwizard.com/pw/medium/172b17093202a29b763a96e3964aa95a.jpg" style="margin: 0; width: 100%;" alt="" />
<p style="font-size: 12px; margin: 0;">PikWizard</p>
</a>
</span>
</span>
Free (free of charge)
Free for personal and commercial use.
Author: Authentic Images
Similar Free Stock Images
Loading...