- Home >
- Stock Photos >
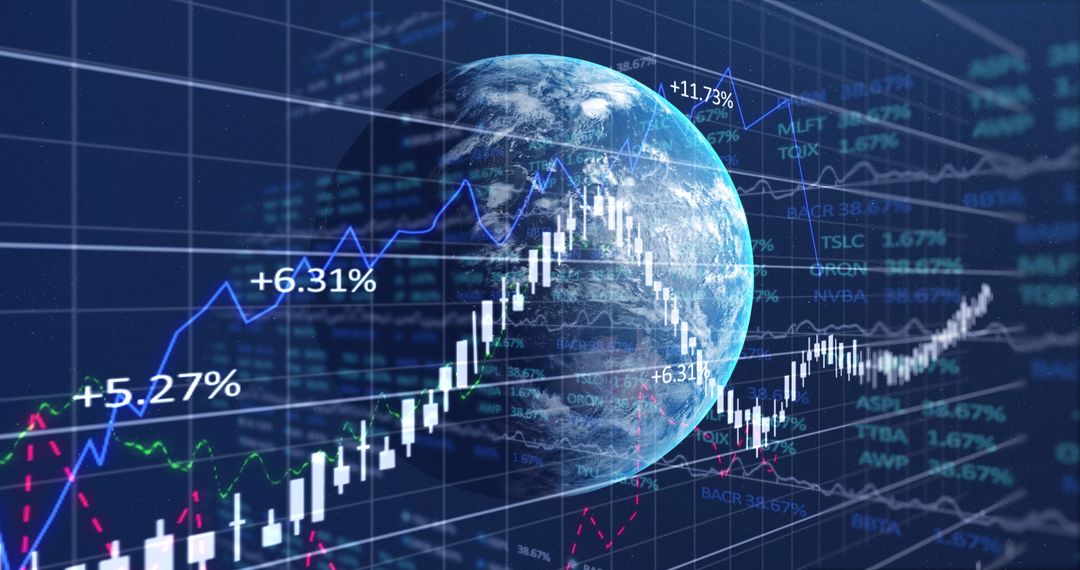
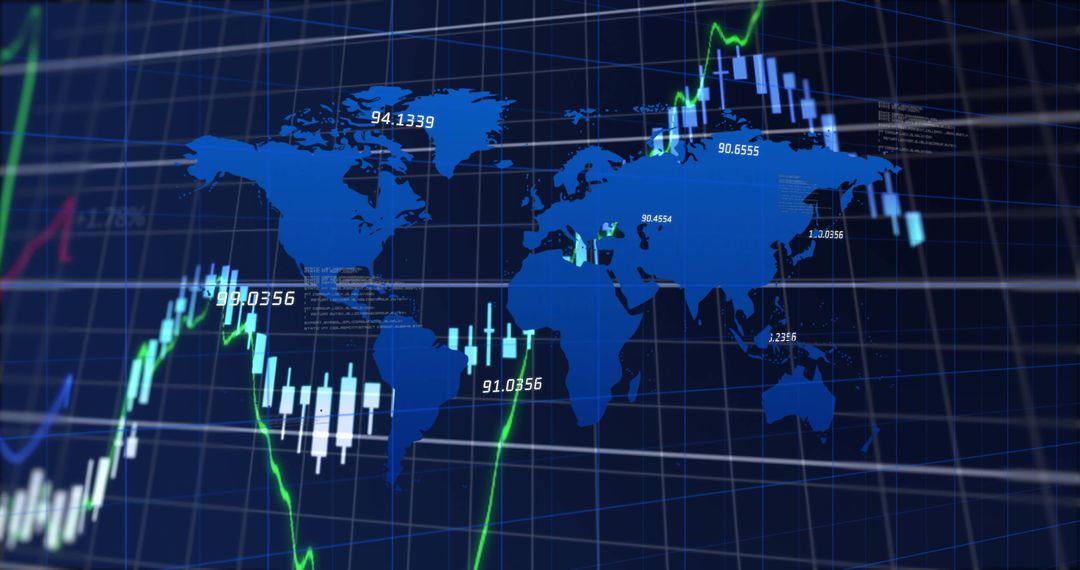
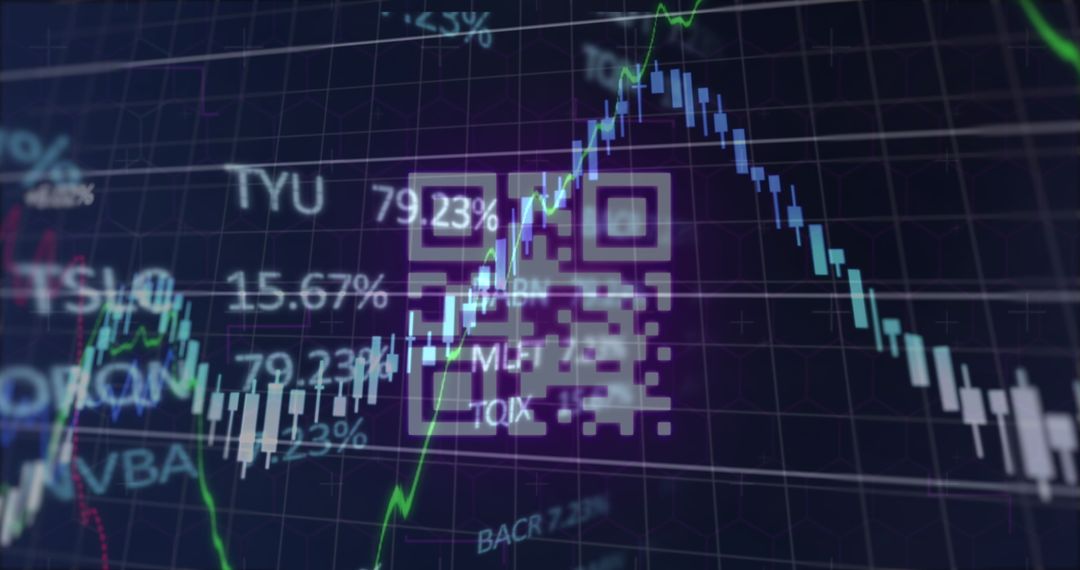
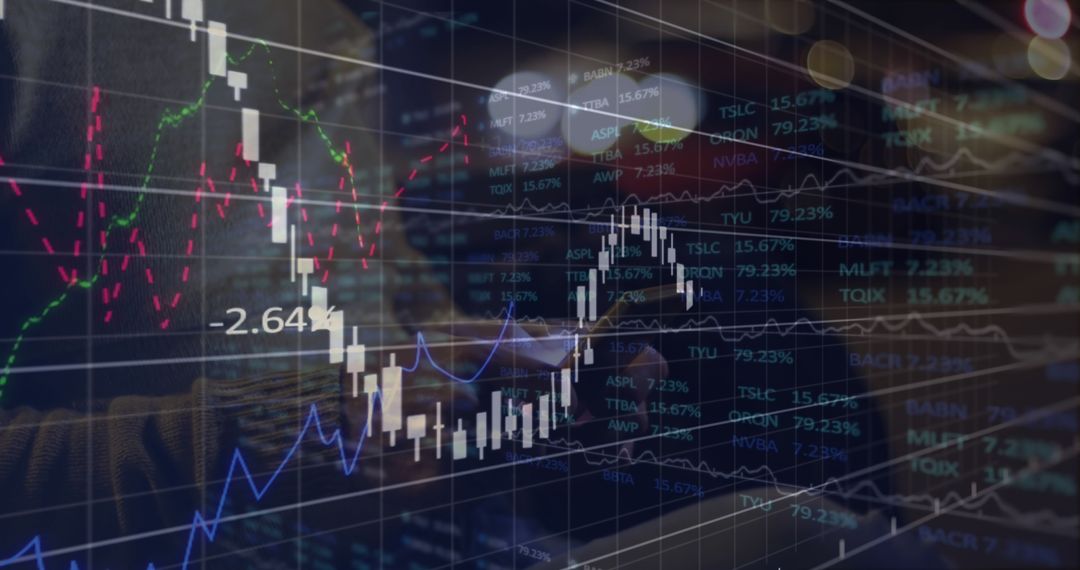
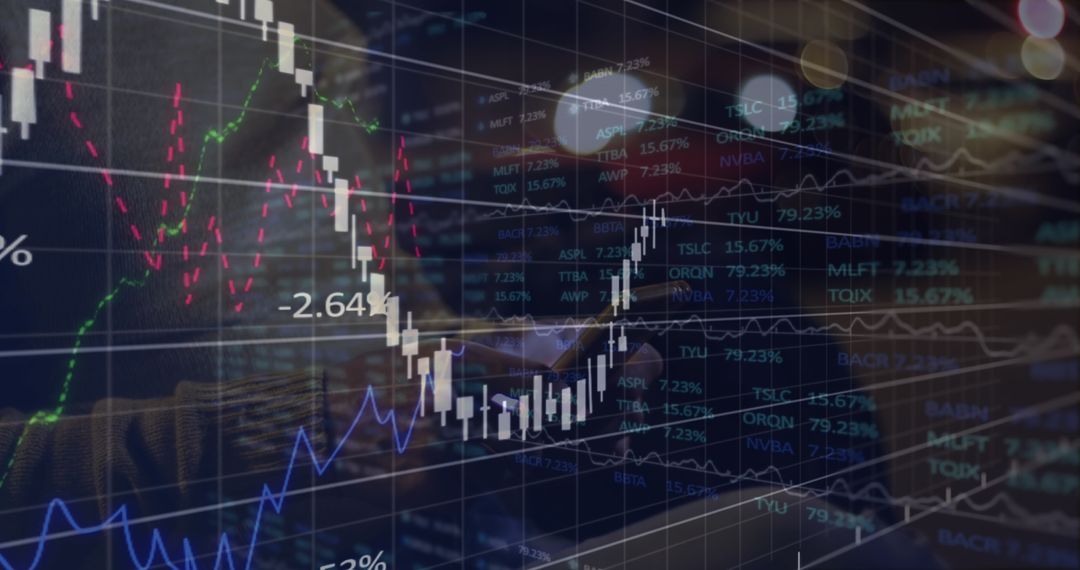
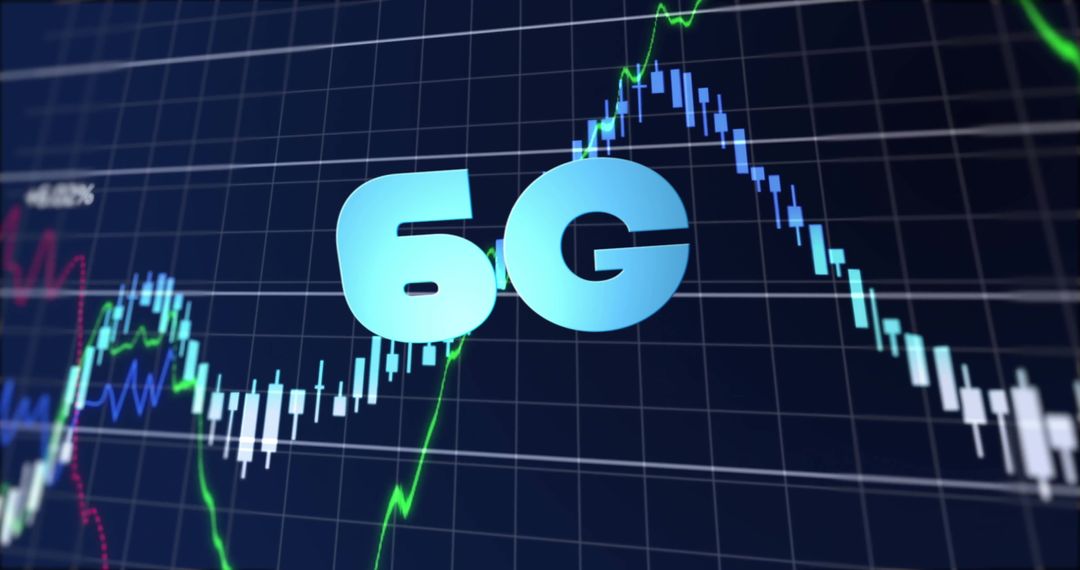
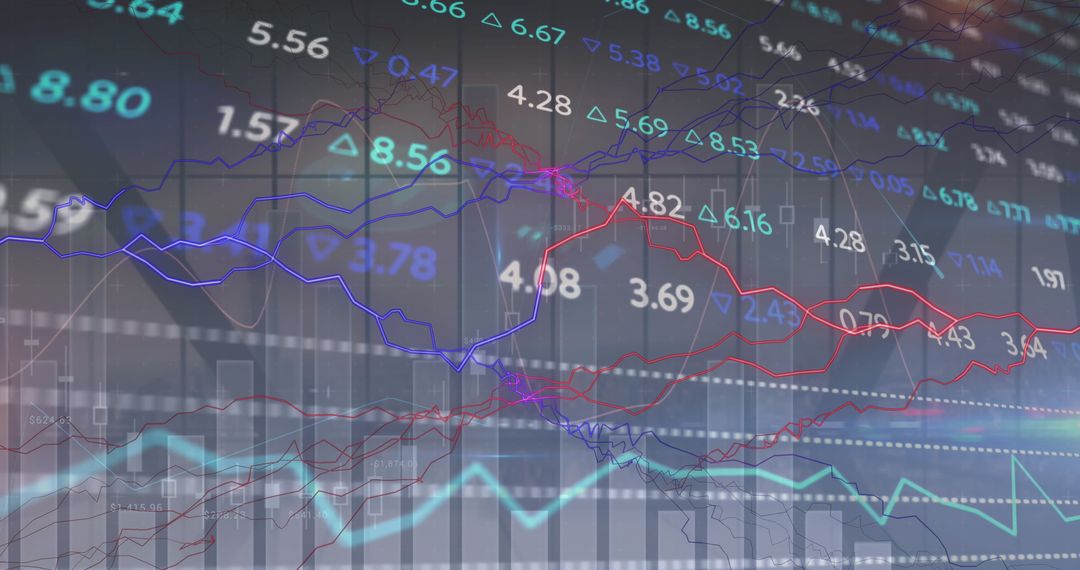
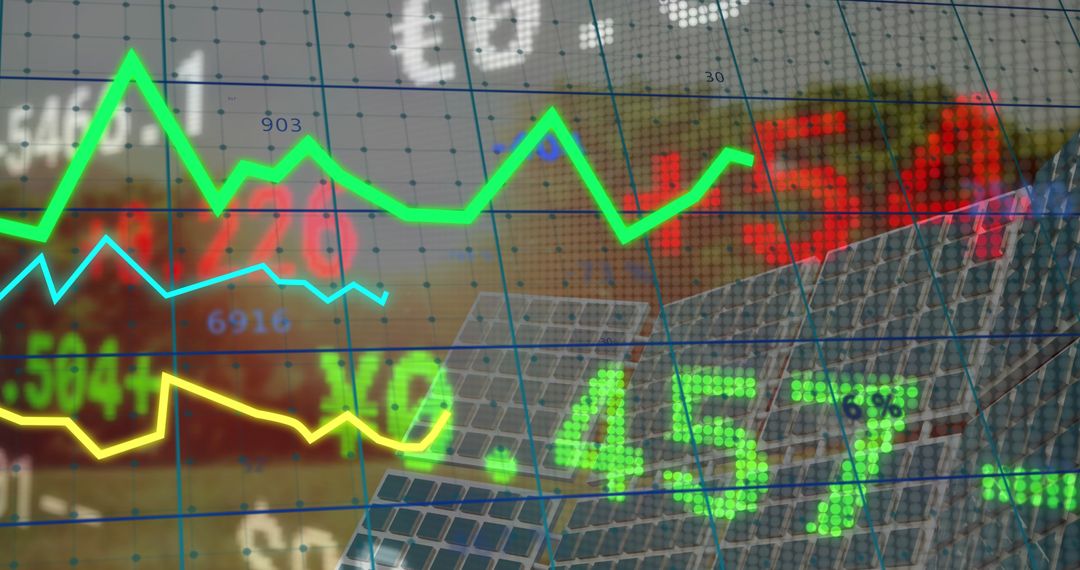
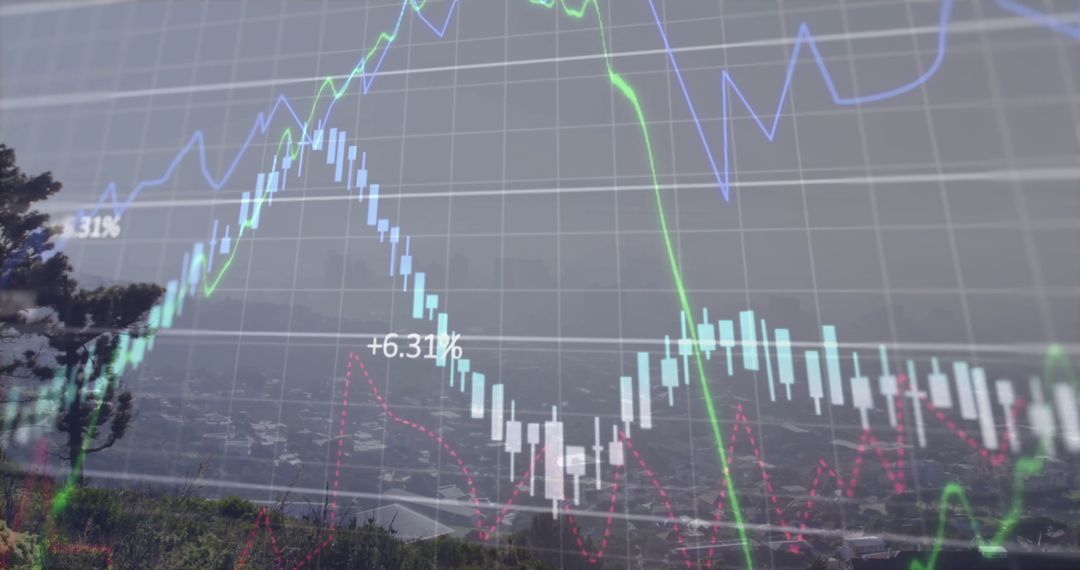
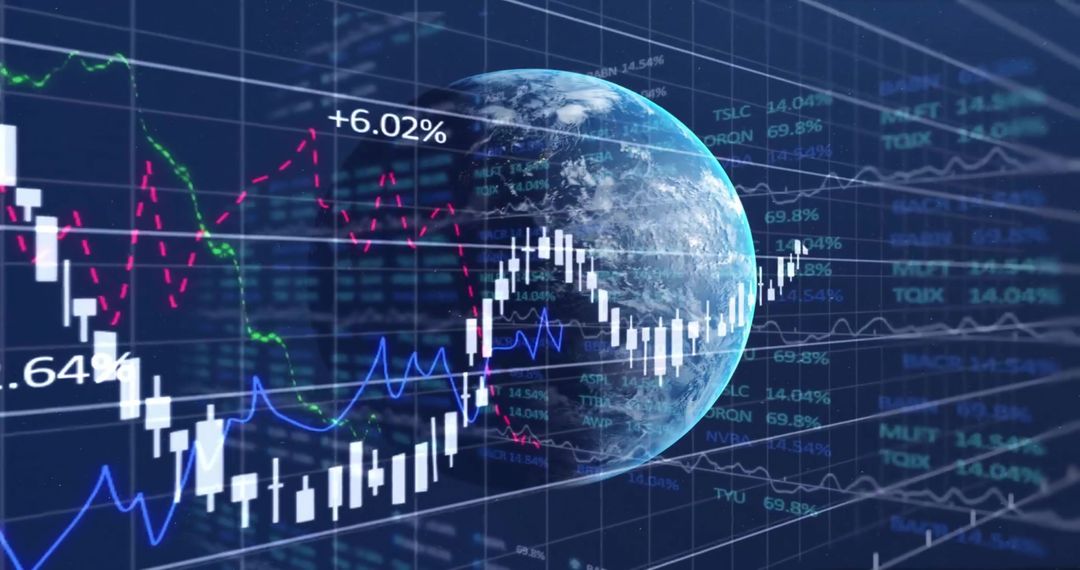
- Vibrant Financial Display with Trend Lines and Candlestick Chart
Vibrant Financial Display with Trend Lines and Candlestick Chart Image

Depiction of a glowing candlestick chart with superimposed trend lines and clear percentage labels, all set on an intricate grid pattern. This image reflects modern tools used in financial trading, data analysis, investment strategies, and stock market insights. Suitable for articles on financial technology trends, digital trading platforms, or reports on market analysis. Adds a futuristic and analytical touch to financial presentations and educational materials.
Powered by  - Get 15% off with code: PIKWIZARD15


2
downloads
downloads
Tags:
More
Credit Photo
If you would like to credit the Photo, here are some ways you can do so
Text Link
photo Link
<span class="text-link">
<span>
<a target="_blank" href=https://pikwizard.com/photo/vibrant-financial-display-with-trend-lines-and-candlestick-chart/b5a8b812e0e2ceb56fc66d41f8595c13/>PikWizard</a>
</span>
</span>
<span class="image-link">
<span
style="margin: 0 0 20px 0; display: inline-block; vertical-align: middle; width: 100%;"
>
<a
target="_blank"
href="https://pikwizard.com/photo/vibrant-financial-display-with-trend-lines-and-candlestick-chart/b5a8b812e0e2ceb56fc66d41f8595c13/"
style="text-decoration: none; font-size: 10px; margin: 0;"
>
<img src="https://pikwizard.com/pw/medium/b5a8b812e0e2ceb56fc66d41f8595c13.jpg" style="margin: 0; width: 100%;" alt="" />
<p style="font-size: 12px; margin: 0;">PikWizard</p>
</a>
</span>
</span>
Free (free of charge)
Free for personal and commercial use.
Author: Creative Art