- Home >
- Stock Photos >
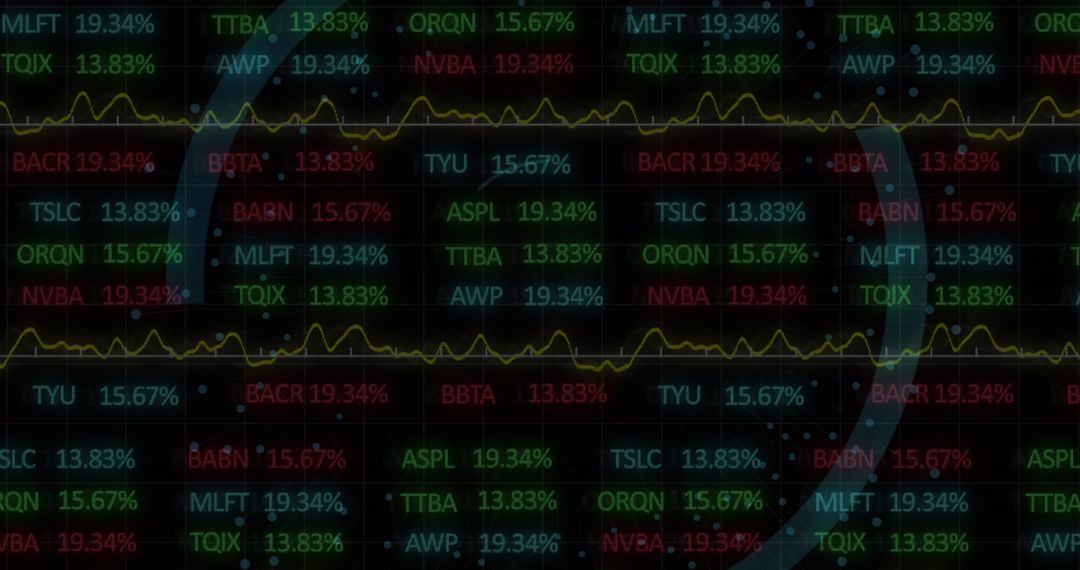
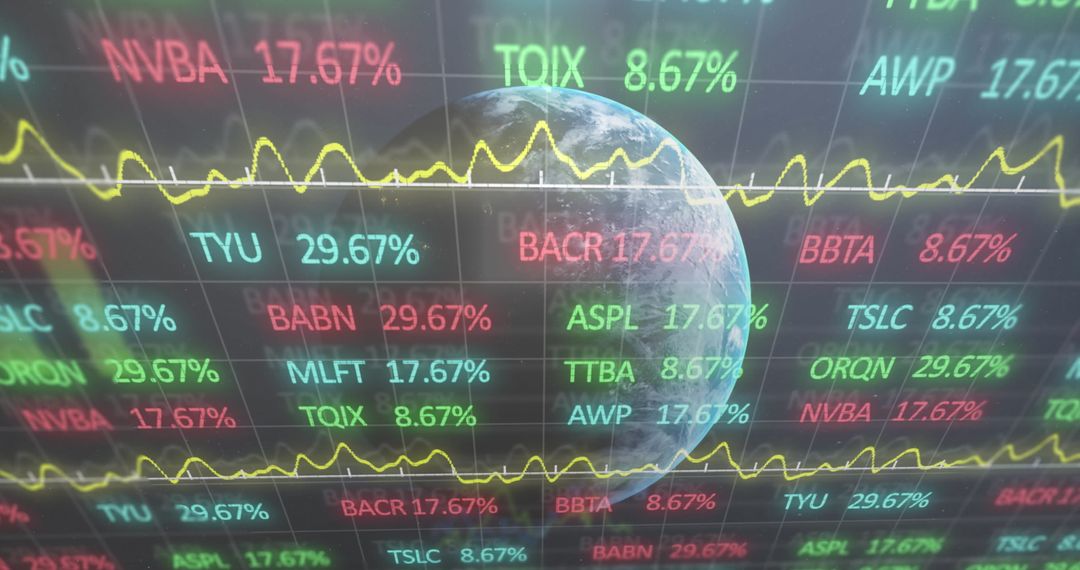
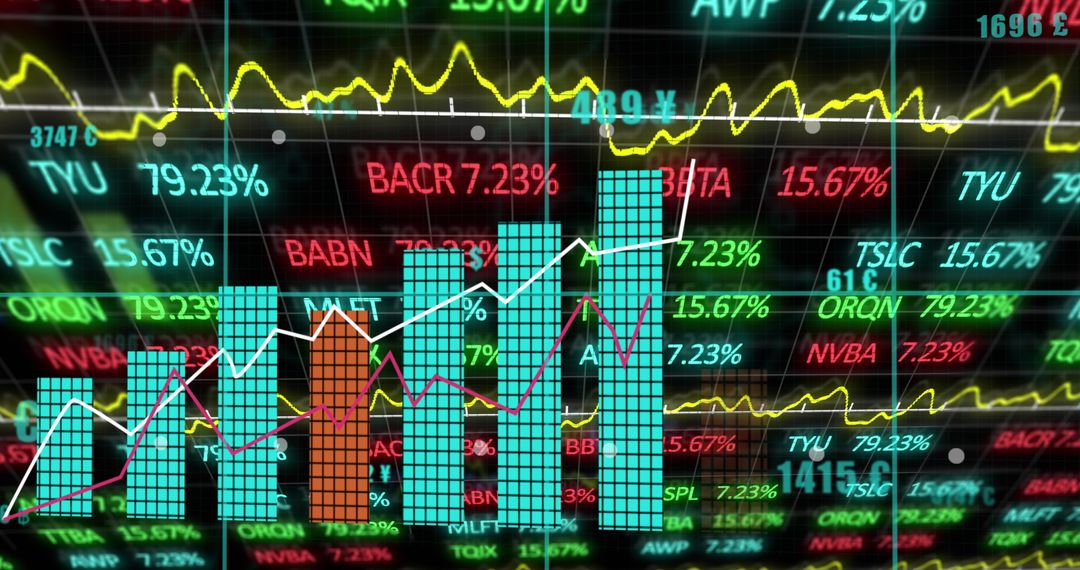
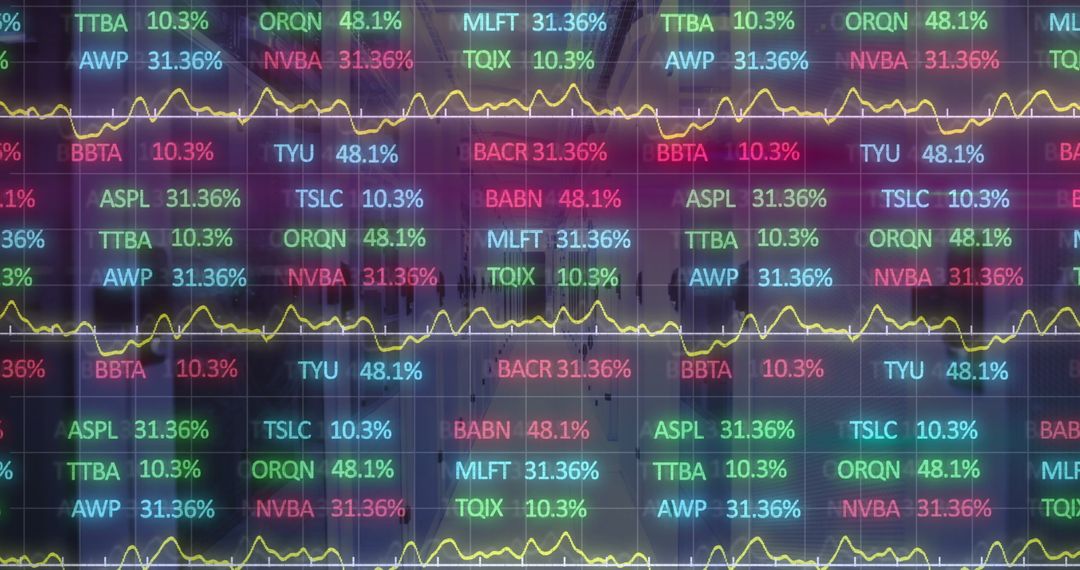
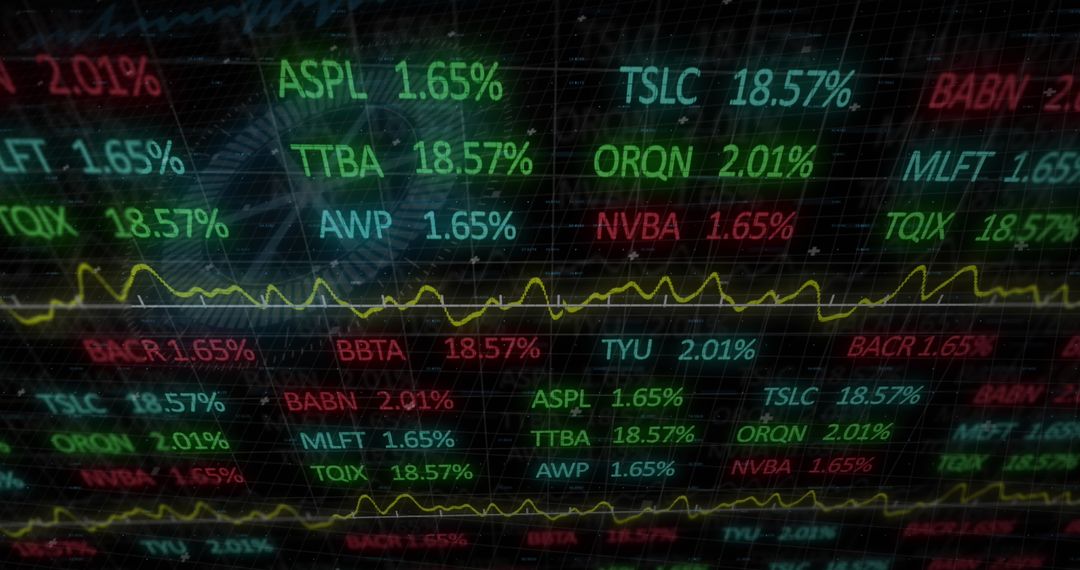
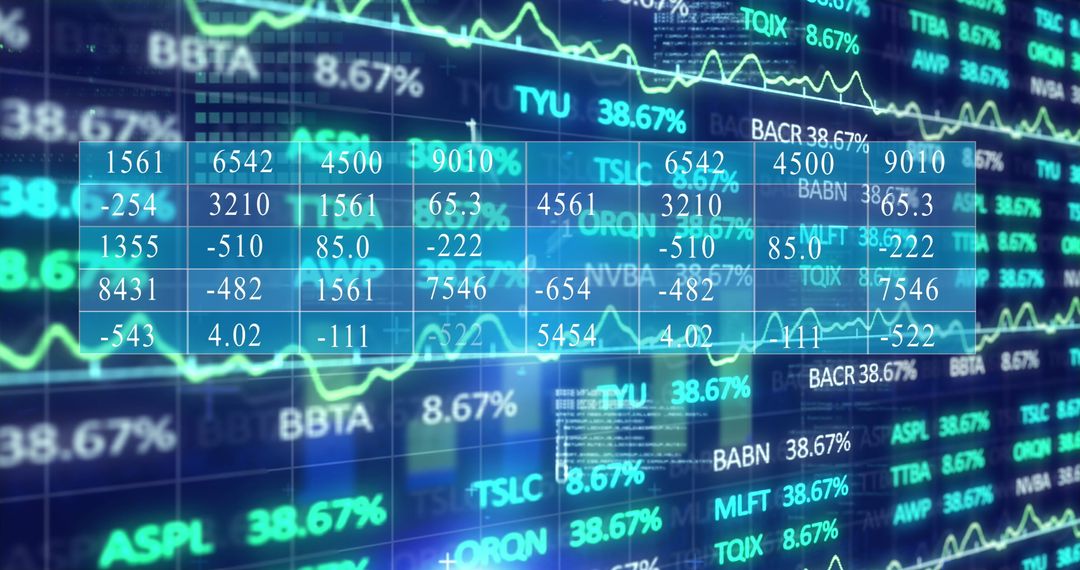
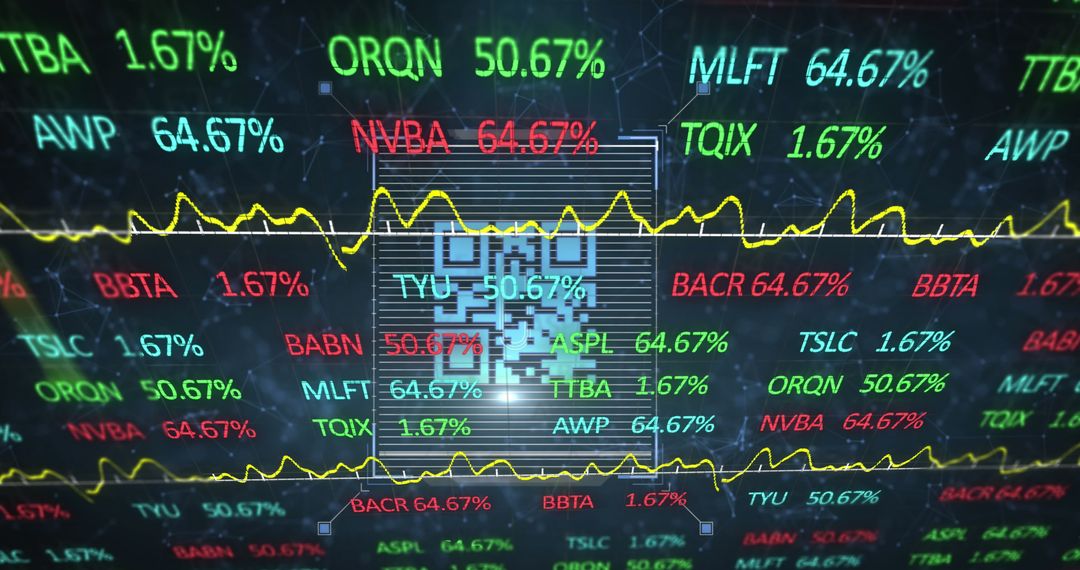
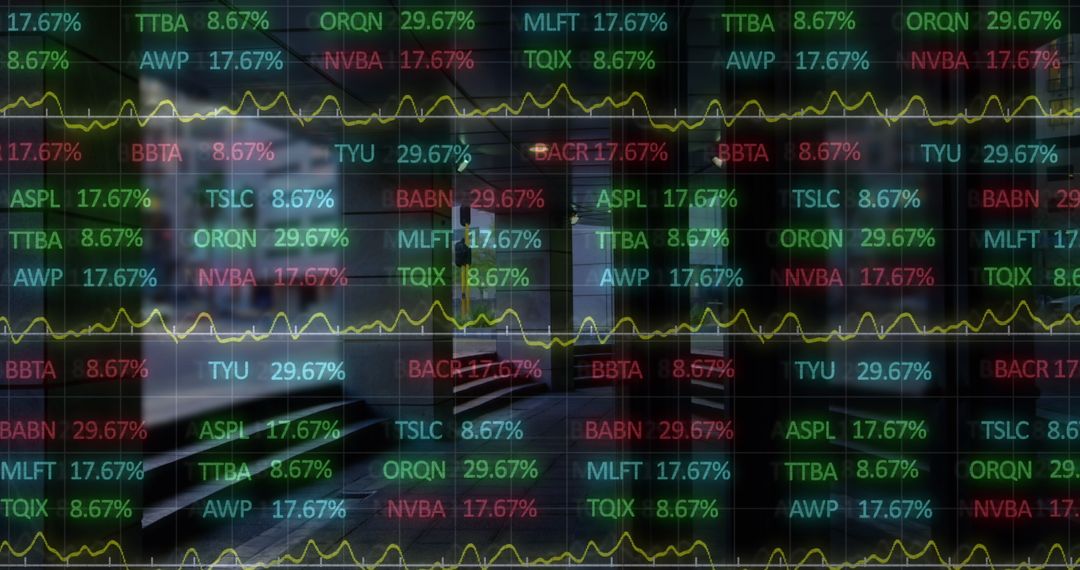
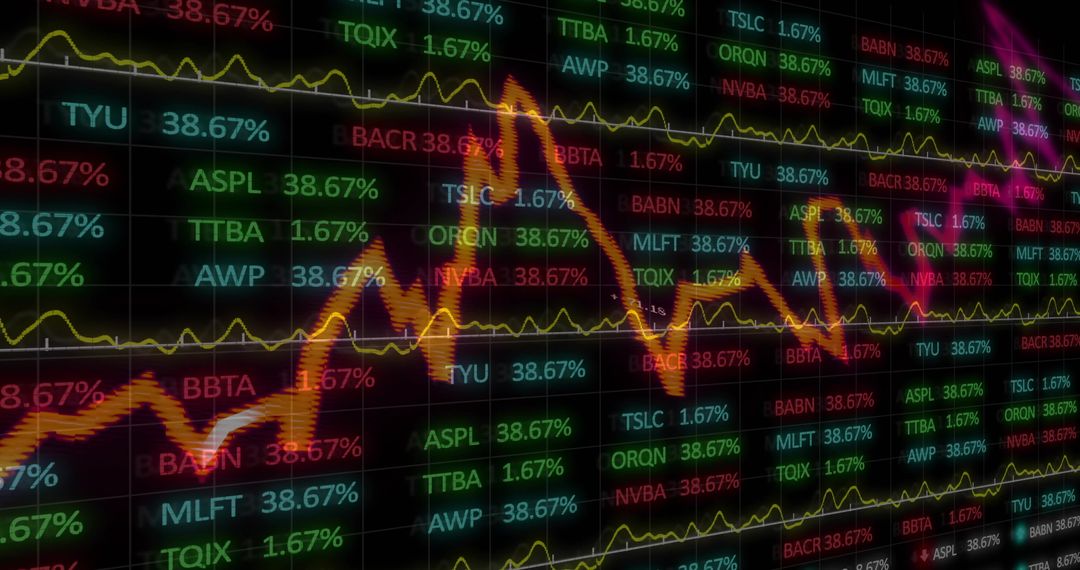
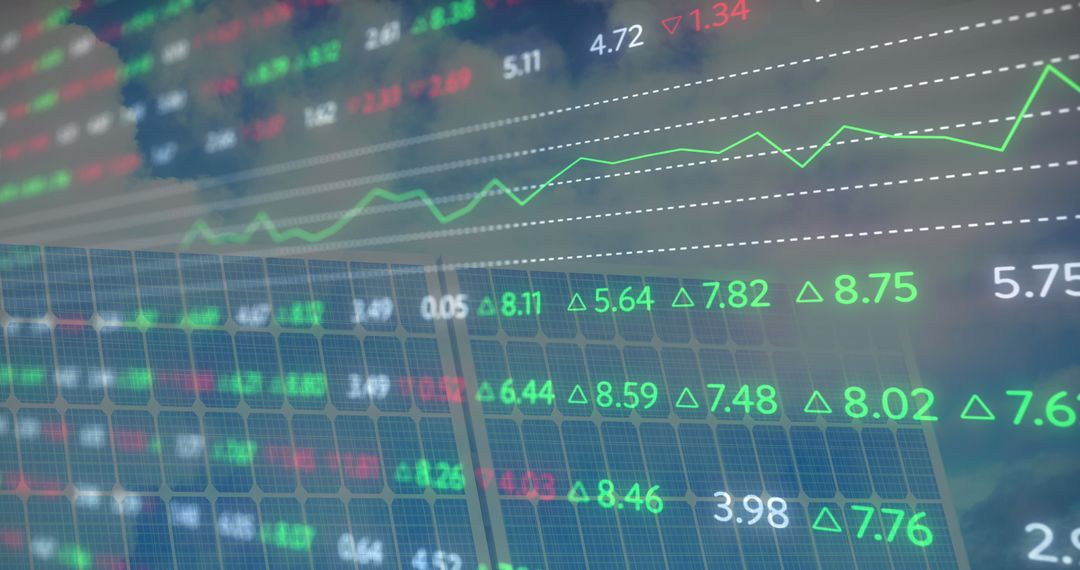
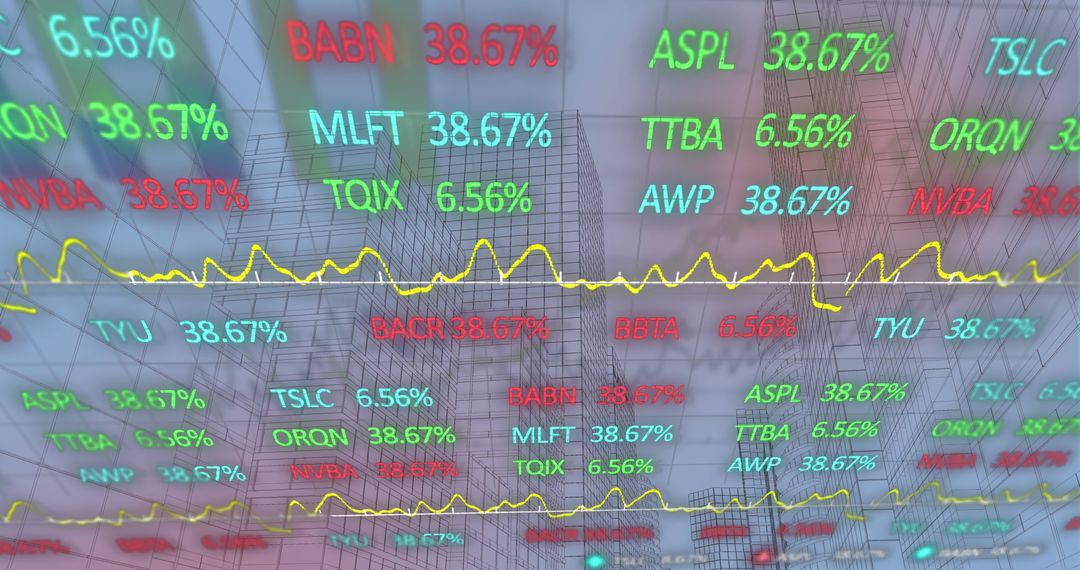
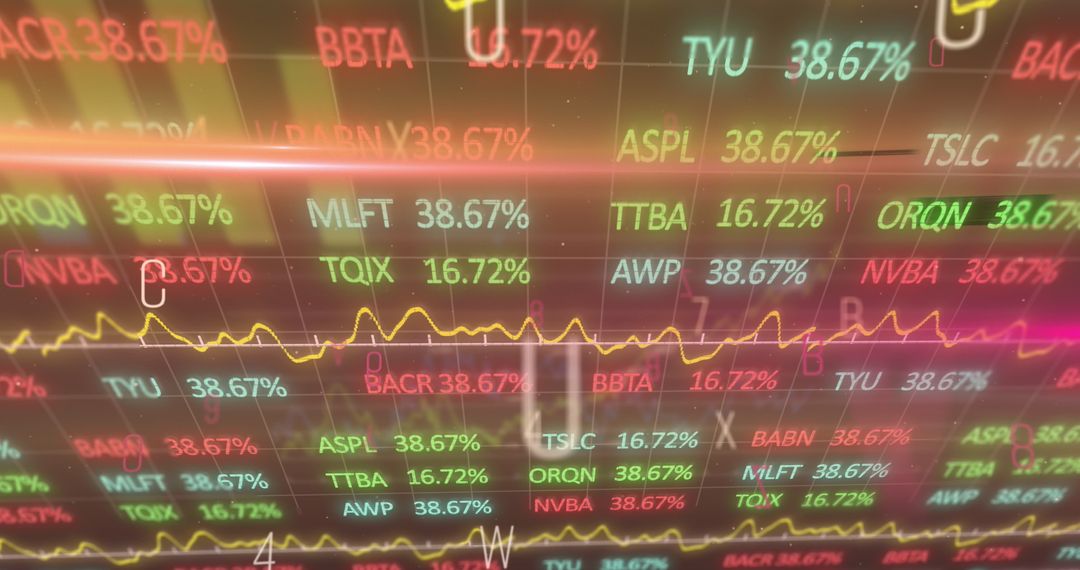
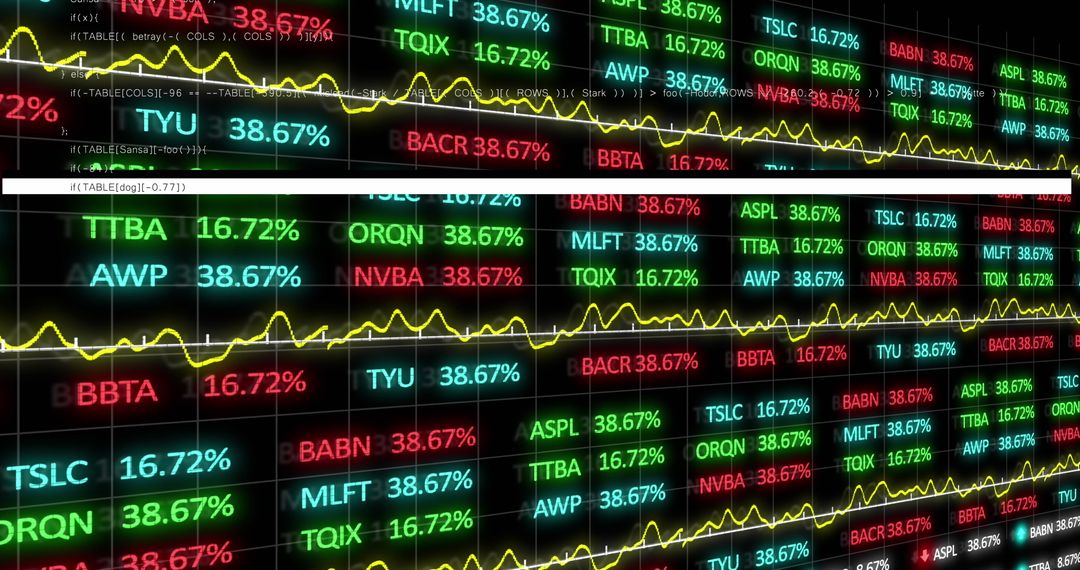
- Vibrant Stock Market Data Display with Real-Time Analytics
Vibrant Stock Market Data Display with Real-Time Analytics Image
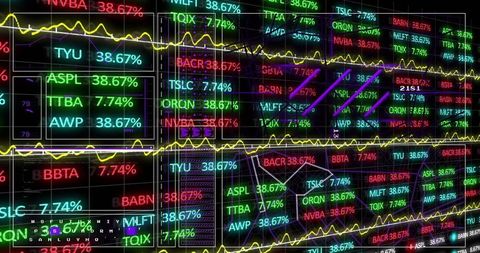
This image showcases a dynamic representation of stock market data, featuring an array of brightly colored ticker symbols, percentage changes, and digital line graphs. Useful for presentations about financial trading, marketing materials targeting investors, or illustrating articles focused on investment and market analysis. It emphasizes technology's influence on trading, suitable for visualizing data-driven finance solutions.
Powered by 


2
downloads
downloads
Tags:
More
Credit Photo
If you would like to credit the Photo, here are some ways you can do so
Text Link
photo Link
<span class="text-link">
<span>
<a target="_blank" href=https://pikwizard.com/photo/vibrant-stock-market-data-display-with-real-time-analytics/a5aead8c693b8fd0f8616dbf076d125b/>PikWizard</a>
</span>
</span>
<span class="image-link">
<span
style="margin: 0 0 20px 0; display: inline-block; vertical-align: middle; width: 100%;"
>
<a
target="_blank"
href="https://pikwizard.com/photo/vibrant-stock-market-data-display-with-real-time-analytics/a5aead8c693b8fd0f8616dbf076d125b/"
style="text-decoration: none; font-size: 10px; margin: 0;"
>
<img src="https://pikwizard.com/pw/medium/a5aead8c693b8fd0f8616dbf076d125b.jpg" style="margin: 0; width: 100%;" alt="" />
<p style="font-size: 12px; margin: 0;">PikWizard</p>
</a>
</span>
</span>
Free (free of charge)
Free for personal and commercial use.
Author: Awesome Content
Similar Free Stock Images

Premium


Premium


Premium


Premium


Premium

Premium


Premium


Premium


Premium


Premium


Premium


Premium


Premium


Premium


Premium


Premium


Premium


Premium


Premium


Premium


Premium


Premium


Premium


Premium