
- Home >
- Stock Photos >
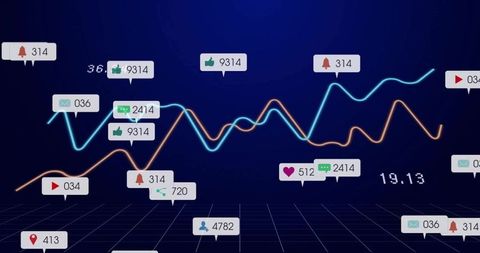
- Virtual Data Analysis with Graphs and User Icons
Virtual Data Analysis with Graphs and User Icons Image

Virtual data environment featuring stylized line graphs in cyan and orange with an emphasis on a prominent tooltip displaying the number 61, symbolizing active users or a key metric. User icons visually represent stakeholders engaging with datasets. Can be used for presentations, infographics, or articles on data analytics, technological advancements, digital interfaces, and data-driven decision-making.
Powered by 


downloads
Tags:
More
Credit Photo
If you would like to credit the Photo, here are some ways you can do so
Text Link
photo Link
<span class="text-link">
<span>
<a target="_blank" href=https://pikwizard.com/photo/virtual-data-analysis-with-graphs-and-user-icons/de009e3c81ec558f48b54f44f4fb103d/>PikWizard</a>
</span>
</span>
<span class="image-link">
<span
style="margin: 0 0 20px 0; display: inline-block; vertical-align: middle; width: 100%;"
>
<a
target="_blank"
href="https://pikwizard.com/photo/virtual-data-analysis-with-graphs-and-user-icons/de009e3c81ec558f48b54f44f4fb103d/"
style="text-decoration: none; font-size: 10px; margin: 0;"
>
<img src="https://pikwizard.com/pw/medium/de009e3c81ec558f48b54f44f4fb103d.jpg" style="margin: 0; width: 100%;" alt="" />
<p style="font-size: 12px; margin: 0;">PikWizard</p>
</a>
</span>
</span>
Free (free of charge)
Free for personal and commercial use.
Author: Authentic Images
Similar Free Stock Images

Premium


Premium


Premium


Premium


Premium

Premium


Premium


Premium


Premium


Premium


Premium


Premium

Premium


Premium

Premium


Premium


Premium

Premium

Premium


Premium


Premium

Premium

Premium


Premium


Premium

Explore More Free Stock Images