
- Home >
- Stock Photos >
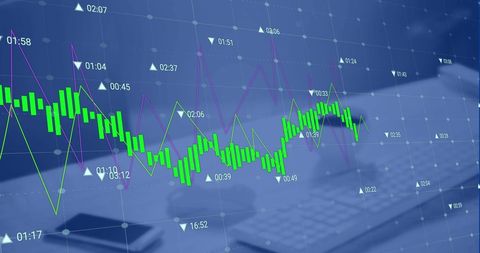
- Virtual Data Streams and Analytics Interface
Virtual Data Streams and Analytics Interface Image

Futuristic theme visualization of digital data with graphs and charts is set against a blue background, embodying concepts of global business dynamics and digital technology advancements. Perfect for use in presentations related to analytics, financial services, technology solutions, or software development. Ideal for website banners, technology industry articles, and workshops on high-tech innovation.
Powered by  - Get 15% off with code: PIKWIZARD15


downloads
Tags:
More
Credit Photo
If you would like to credit the Photo, here are some ways you can do so
Text Link
photo Link
<span class="text-link">
<span>
<a target="_blank" href=https://pikwizard.com/photo/virtual-data-streams-and-analytics-interface/ba6752bf4aa5cb640fa6720b46809a25/>PikWizard</a>
</span>
</span>
<span class="image-link">
<span
style="margin: 0 0 20px 0; display: inline-block; vertical-align: middle; width: 100%;"
>
<a
target="_blank"
href="https://pikwizard.com/photo/virtual-data-streams-and-analytics-interface/ba6752bf4aa5cb640fa6720b46809a25/"
style="text-decoration: none; font-size: 10px; margin: 0;"
>
<img src="https://pikwizard.com/pw/medium/ba6752bf4aa5cb640fa6720b46809a25.jpg" style="margin: 0; width: 100%;" alt="" />
<p style="font-size: 12px; margin: 0;">PikWizard</p>
</a>
</span>
</span>
Free (free of charge)
Free for personal and commercial use.
Author: People Creations
Similar Free Stock Images

Premium


Premium


Premium


Premium


Premium


Premium


Premium


Premium

Premium


Premium


Premium


Premium


Premium


Premium


Premium

Premium


Premium


Premium


Premium


Premium


Premium


Premium


Premium


Premium


Premium


Explore More Free Stock Images