
- Home >
- Stock Photos >
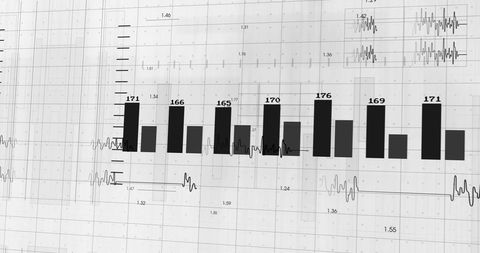
- Virtual Financial Data Analytics on White Background
Virtual Financial Data Analytics on White Background Image

Abstract visualization of financial data analytics with bar and line charts on a white background. Useful for illustrating concepts related to finance, business trends, and digital data processing in presentations, reports, and educational materials. The image emphasizes the importance of statistics and analysis in global business decisions.
Powered by  - Get 15% off with code: PIKWIZARD15


downloads
Tags:
More
Credit Photo
If you would like to credit the Photo, here are some ways you can do so
Text Link
photo Link
<span class="text-link">
<span>
<a target="_blank" href=https://pikwizard.com/photo/virtual-financial-data-analytics-on-white-background/053aa9cb351b52174a37cc52caedf66e/>PikWizard</a>
</span>
</span>
<span class="image-link">
<span
style="margin: 0 0 20px 0; display: inline-block; vertical-align: middle; width: 100%;"
>
<a
target="_blank"
href="https://pikwizard.com/photo/virtual-financial-data-analytics-on-white-background/053aa9cb351b52174a37cc52caedf66e/"
style="text-decoration: none; font-size: 10px; margin: 0;"
>
<img src="https://pikwizard.com/pw/medium/053aa9cb351b52174a37cc52caedf66e.jpg" style="margin: 0; width: 100%;" alt="" />
<p style="font-size: 12px; margin: 0;">PikWizard</p>
</a>
</span>
</span>
Free (free of charge)
Free for personal and commercial use.
Author: Authentic Images
Similar Free Stock Images

Premium


Premium


Premium

Premium


Premium


Premium


Premium


Premium


Premium


Premium


Premium


Premium


Premium


Premium


Premium


Premium


Premium


Premium

Premium


Premium


Premium


Premium

Premium


Premium

Premium

Explore More Free Stock Images