- Home >
- Stock Photos >
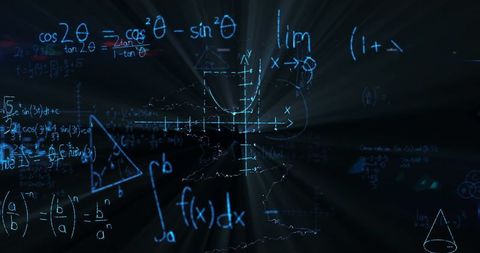
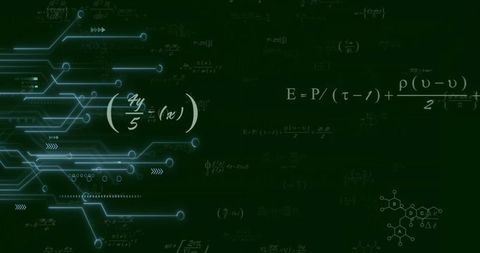
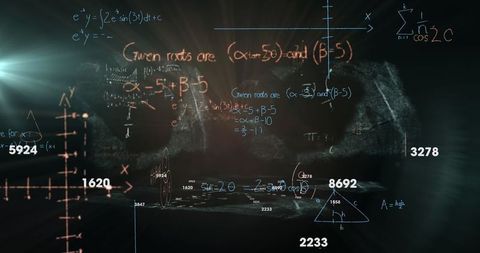
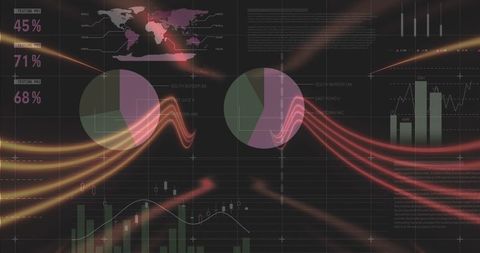
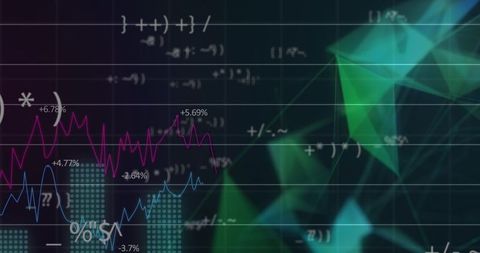
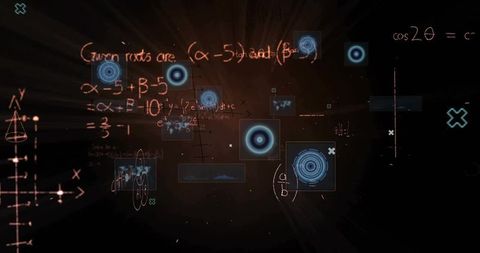
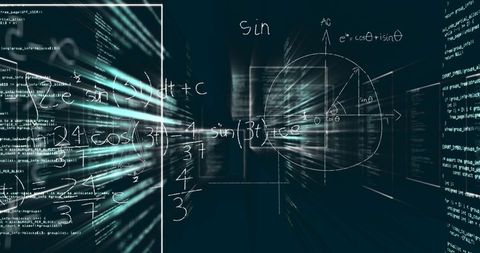
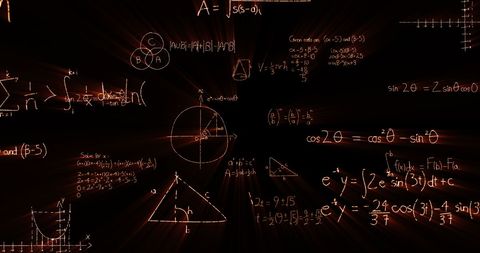
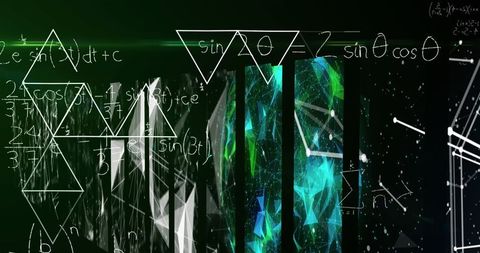
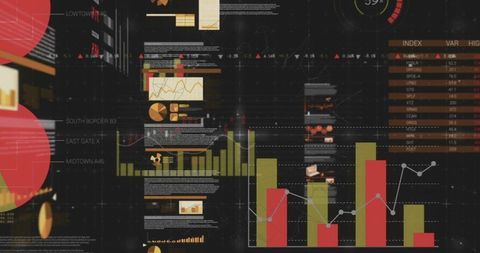
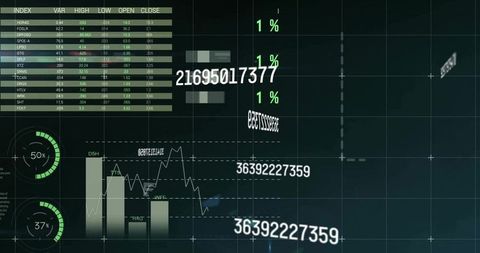
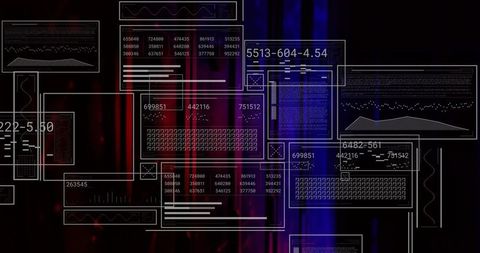
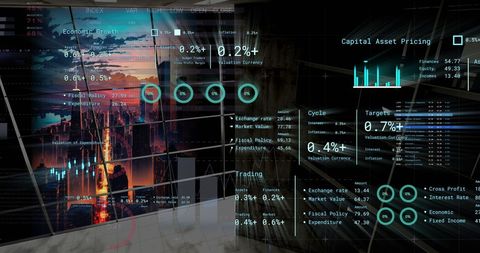
- Virtual Interface with Math Formulas and Data Visualization Graphics
Virtual Interface with Math Formulas and Data Visualization Graphics Image

Panels displaying math formulas and data analytics graphics creating a concept of futuristic technology and digital interface. Ideal for illustrating themes like data analysis, scientific research, technology, and futuristic design. Useful for tech blogs, presentations, and educational materials.

downloads
Tags:
More
Credit Photo
If you would like to credit the Photo, here are some ways you can do so
Text Link
photo Link
<span class="text-link">
<span>
<a target="_blank" href=https://pikwizard.com/photo/virtual-interface-with-math-formulas-and-data-visualization-graphics/18d7746ec2862aebe5a204ed2e5bdfe7/>PikWizard</a>
</span>
</span>
<span class="image-link">
<span
style="margin: 0 0 20px 0; display: inline-block; vertical-align: middle; width: 100%;"
>
<a
target="_blank"
href="https://pikwizard.com/photo/virtual-interface-with-math-formulas-and-data-visualization-graphics/18d7746ec2862aebe5a204ed2e5bdfe7/"
style="text-decoration: none; font-size: 10px; margin: 0;"
>
<img src="https://pikwizard.com/pw/medium/18d7746ec2862aebe5a204ed2e5bdfe7.jpg" style="margin: 0; width: 100%;" alt="" />
<p style="font-size: 12px; margin: 0;">PikWizard</p>
</a>
</span>
</span>
Free (free of charge)
Free for personal and commercial use.
Author: Authentic Images