
- Home >
- Stock Photos >
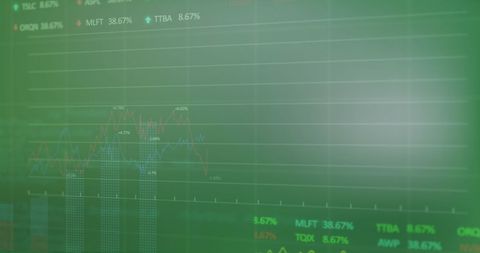
- Virtual Scripting Analysis and Data Visualization Interface
Virtual Scripting Analysis and Data Visualization Interface Image

This illustration captures the synthesis of technology and analytics with a focus on coding environments. Blurred central text represents dynamic programming elements within a virtual interface, accompanied by digital charts, data points, and stock tickers. Suitable for articles or designs related to technology innovation, software programming tutorials, or futuristic IT themes.
Powered by  - Get 15% off with code: PIKWIZARD15


downloads
Tags:
More
Credit Photo
If you would like to credit the Photo, here are some ways you can do so
Text Link
photo Link
<span class="text-link">
<span>
<a target="_blank" href=https://pikwizard.com/photo/virtual-scripting-analysis-and-data-visualization-interface/6bdd137045b79136b9513a80f1cdc907/>PikWizard</a>
</span>
</span>
<span class="image-link">
<span
style="margin: 0 0 20px 0; display: inline-block; vertical-align: middle; width: 100%;"
>
<a
target="_blank"
href="https://pikwizard.com/photo/virtual-scripting-analysis-and-data-visualization-interface/6bdd137045b79136b9513a80f1cdc907/"
style="text-decoration: none; font-size: 10px; margin: 0;"
>
<img src="https://pikwizard.com/pw/medium/6bdd137045b79136b9513a80f1cdc907.jpg" style="margin: 0; width: 100%;" alt="" />
<p style="font-size: 12px; margin: 0;">PikWizard</p>
</a>
</span>
</span>
Free (free of charge)
Free for personal and commercial use.
Author: Creative Art
Similar Free Stock Images

Premium


Premium

Premium


Premium


Premium


Premium


Premium

Premium


Premium


Premium

Premium
Premium

Premium


Premium

Premium


Premium


Premium


Premium


Premium


Premium


Premium


Premium


Premium


Premium


Premium


Explore More Free Stock Images