
- Home >
- Stock Photos >
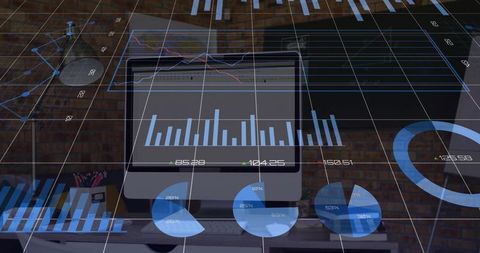
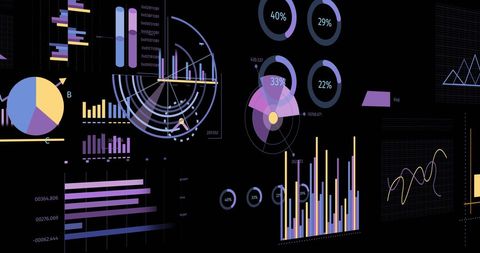
- Virtual Statistics Dashboard Displaying Financial Data Visualizations
Virtual Statistics Dashboard Displaying Financial Data Visualizations Image

Digital display of various charts and graphs showcasing financial statistics and data processing, overlaid on a computer screen. This visual is ideal for use in presentations, marketing materials, or websites related to business analytics, financial technology, or data visualization. Perfect for illustrating complex financial concepts in a comprehensible manner.
Powered by 


downloads
Tags:
More
Credit Photo
If you would like to credit the Photo, here are some ways you can do so
Text Link
photo Link
<span class="text-link">
<span>
<a target="_blank" href=https://pikwizard.com/photo/virtual-statistics-dashboard-displaying-financial-data-visualizations/8adcc1c4200e3a208a6ef045599adfe9/>PikWizard</a>
</span>
</span>
<span class="image-link">
<span
style="margin: 0 0 20px 0; display: inline-block; vertical-align: middle; width: 100%;"
>
<a
target="_blank"
href="https://pikwizard.com/photo/virtual-statistics-dashboard-displaying-financial-data-visualizations/8adcc1c4200e3a208a6ef045599adfe9/"
style="text-decoration: none; font-size: 10px; margin: 0;"
>
<img src="https://pikwizard.com/pw/medium/8adcc1c4200e3a208a6ef045599adfe9.jpg" style="margin: 0; width: 100%;" alt="" />
<p style="font-size: 12px; margin: 0;">PikWizard</p>
</a>
</span>
</span>
Free (free of charge)
Free for personal and commercial use.
Author: Authentic Images
Similar Free Stock Images

Premium


Premium


Premium

Premium

Premium

Premium


Premium


Premium


Premium


Premium


Premium


Premium


Premium


Premium


Premium


Premium

Premium

Premium


Premium


Premium


Premium


Premium


Premium


Premium


Premium

Explore More Free Stock Images