- Home >
- Stock Photos >
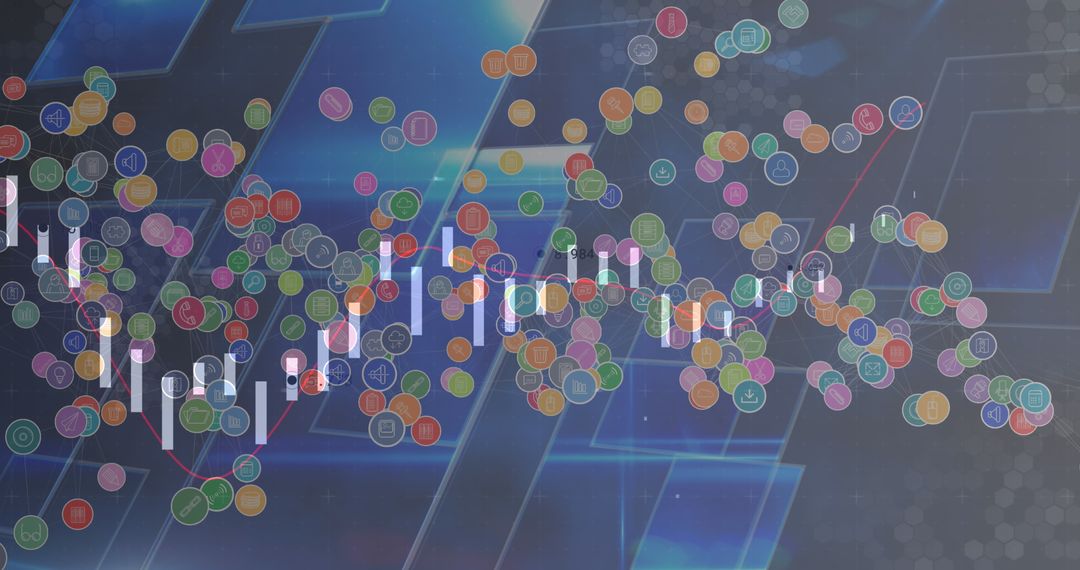
- Virus Cells and Data Charts Depicting Pandemic Analysis
Virus Cells and Data Charts Depicting Pandemic Analysis Image

Illustration shows virus cells and statistical data charts, symbolizing the analysis of Covid-19's impact on economies and healthcare. Useful for articles on pandemic effects, presentations on public health data, or educational material on economic and health crisis management.
Powered by  - Get 15% off with code: PIKWIZARD15


2
downloads
downloads
Tags:
More
Credit Photo
If you would like to credit the Photo, here are some ways you can do so
Text Link
photo Link
<span class="text-link">
<span>
<a target="_blank" href=https://pikwizard.com/photo/virus-cells-and-data-charts-depicting-pandemic-analysis/9cc348d3a9a109311419ff59871a2191/>PikWizard</a>
</span>
</span>
<span class="image-link">
<span
style="margin: 0 0 20px 0; display: inline-block; vertical-align: middle; width: 100%;"
>
<a
target="_blank"
href="https://pikwizard.com/photo/virus-cells-and-data-charts-depicting-pandemic-analysis/9cc348d3a9a109311419ff59871a2191/"
style="text-decoration: none; font-size: 10px; margin: 0;"
>
<img src="https://pikwizard.com/pw/medium/9cc348d3a9a109311419ff59871a2191.jpg" style="margin: 0; width: 100%;" alt="" />
<p style="font-size: 12px; margin: 0;">PikWizard</p>
</a>
</span>
</span>
Free (free of charge)
Free for personal and commercial use.
Author: Creative Art
Similar Free Stock Images

Premium


Premium


Premium


Premium


Premium


Premium


Premium


Premium


Premium


Premium


Premium


Premium


Premium


Premium


Premium


Premium


Premium


Premium


Premium


Premium


Premium


Premium


Premium


Premium